[ Bathymetry | Backscatter | Optical Validation | Geomorphology ]
The collection and analysis of photographic data to ground truth and interpret multibeam data layers with the goal of characterizing seafloor habitats.
Coral Cover Map

Click thumbnail map to view a high-resolution JPG.
| Go to descriptions of optical data collection and products. |
| Download: Accessory Files |
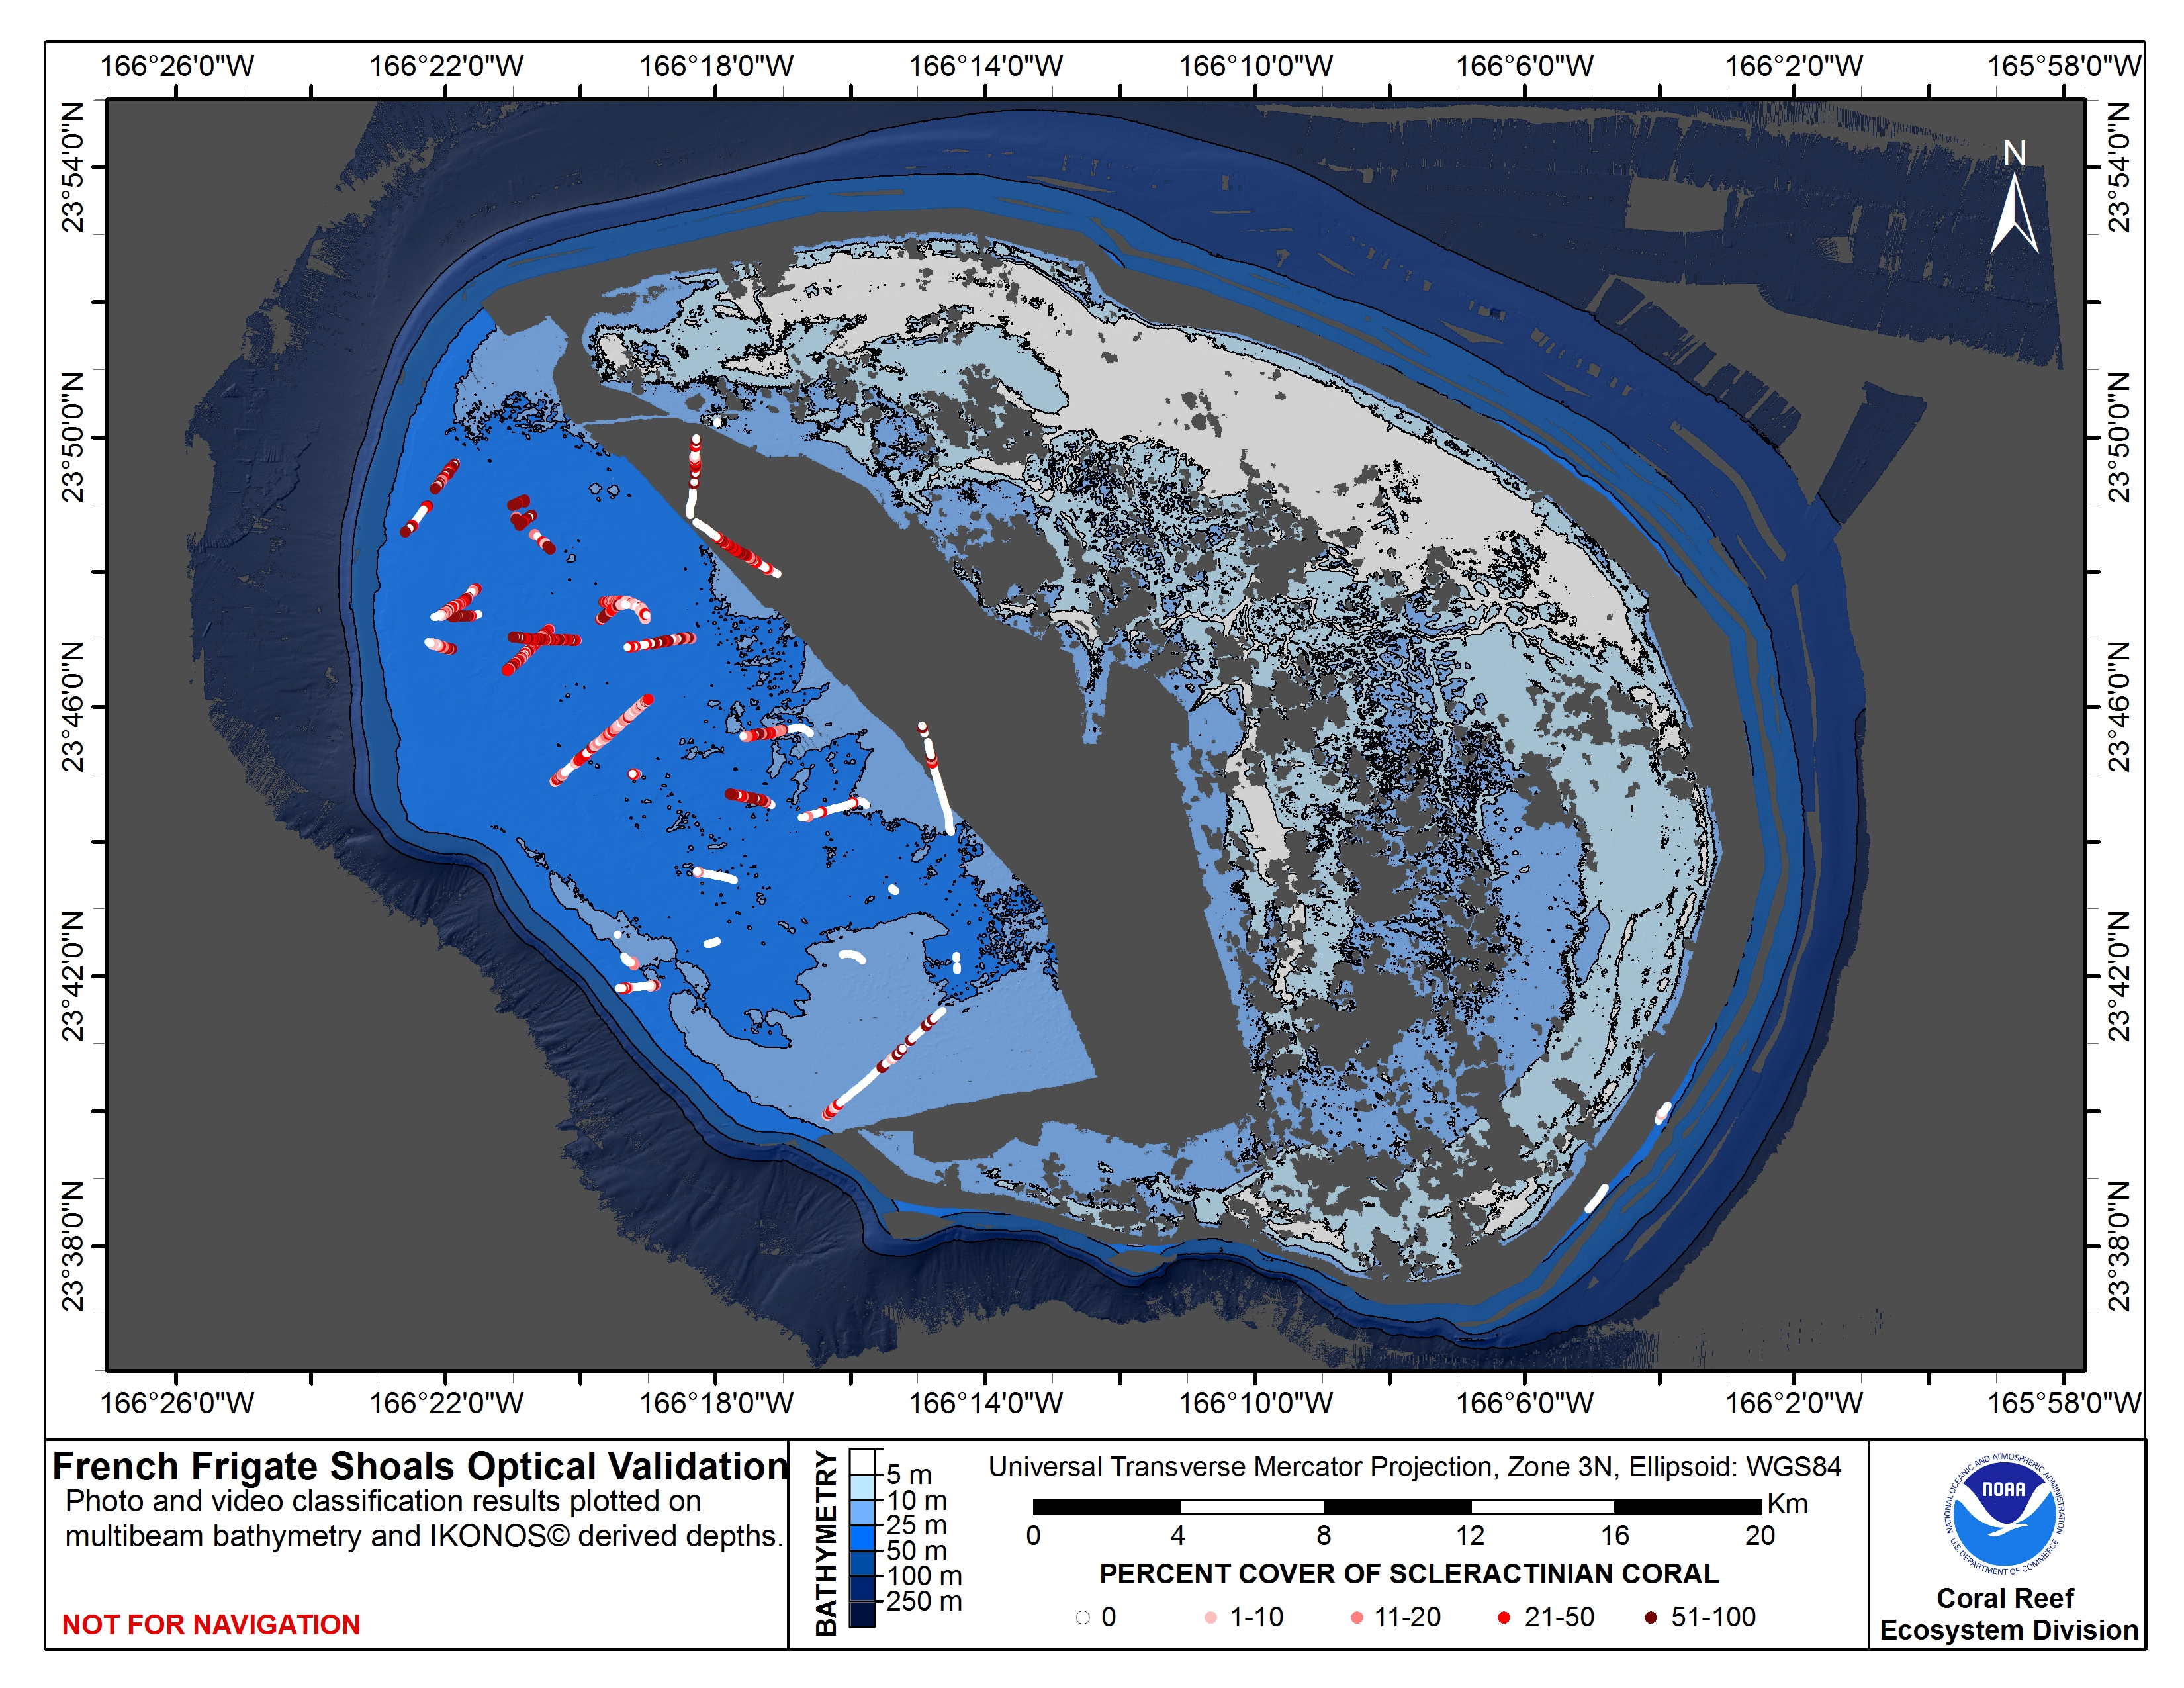
The map above shows percent cover values of scleractinian coral derived from classified photos and videos (see sample images below) collected at French Frigate Shoals in 2001, 2002, 2003, 2004, 2005 and 2008. Each point represents an analyzed video frame or photo. Note that the percent classes are unevenly sized to better display this relatively low-abundance bottom type.
The optical data are classified by substrate type, type of live growth on bottom, geomorphic zone, and the size and abundance of holes in the substrate. Although what we show here is the percentage of coral, the shapefiles contain data on all those categories, enabling users to map the occurrence of any combination of characteristics that are included in the classification scheme. (See sidebar for shapefiles.)
Mobile Fauna Map

Click thumbnail map to view a high-resolution JPG.
| Descriptions of optical data products. |
| Download: Accessory Files |
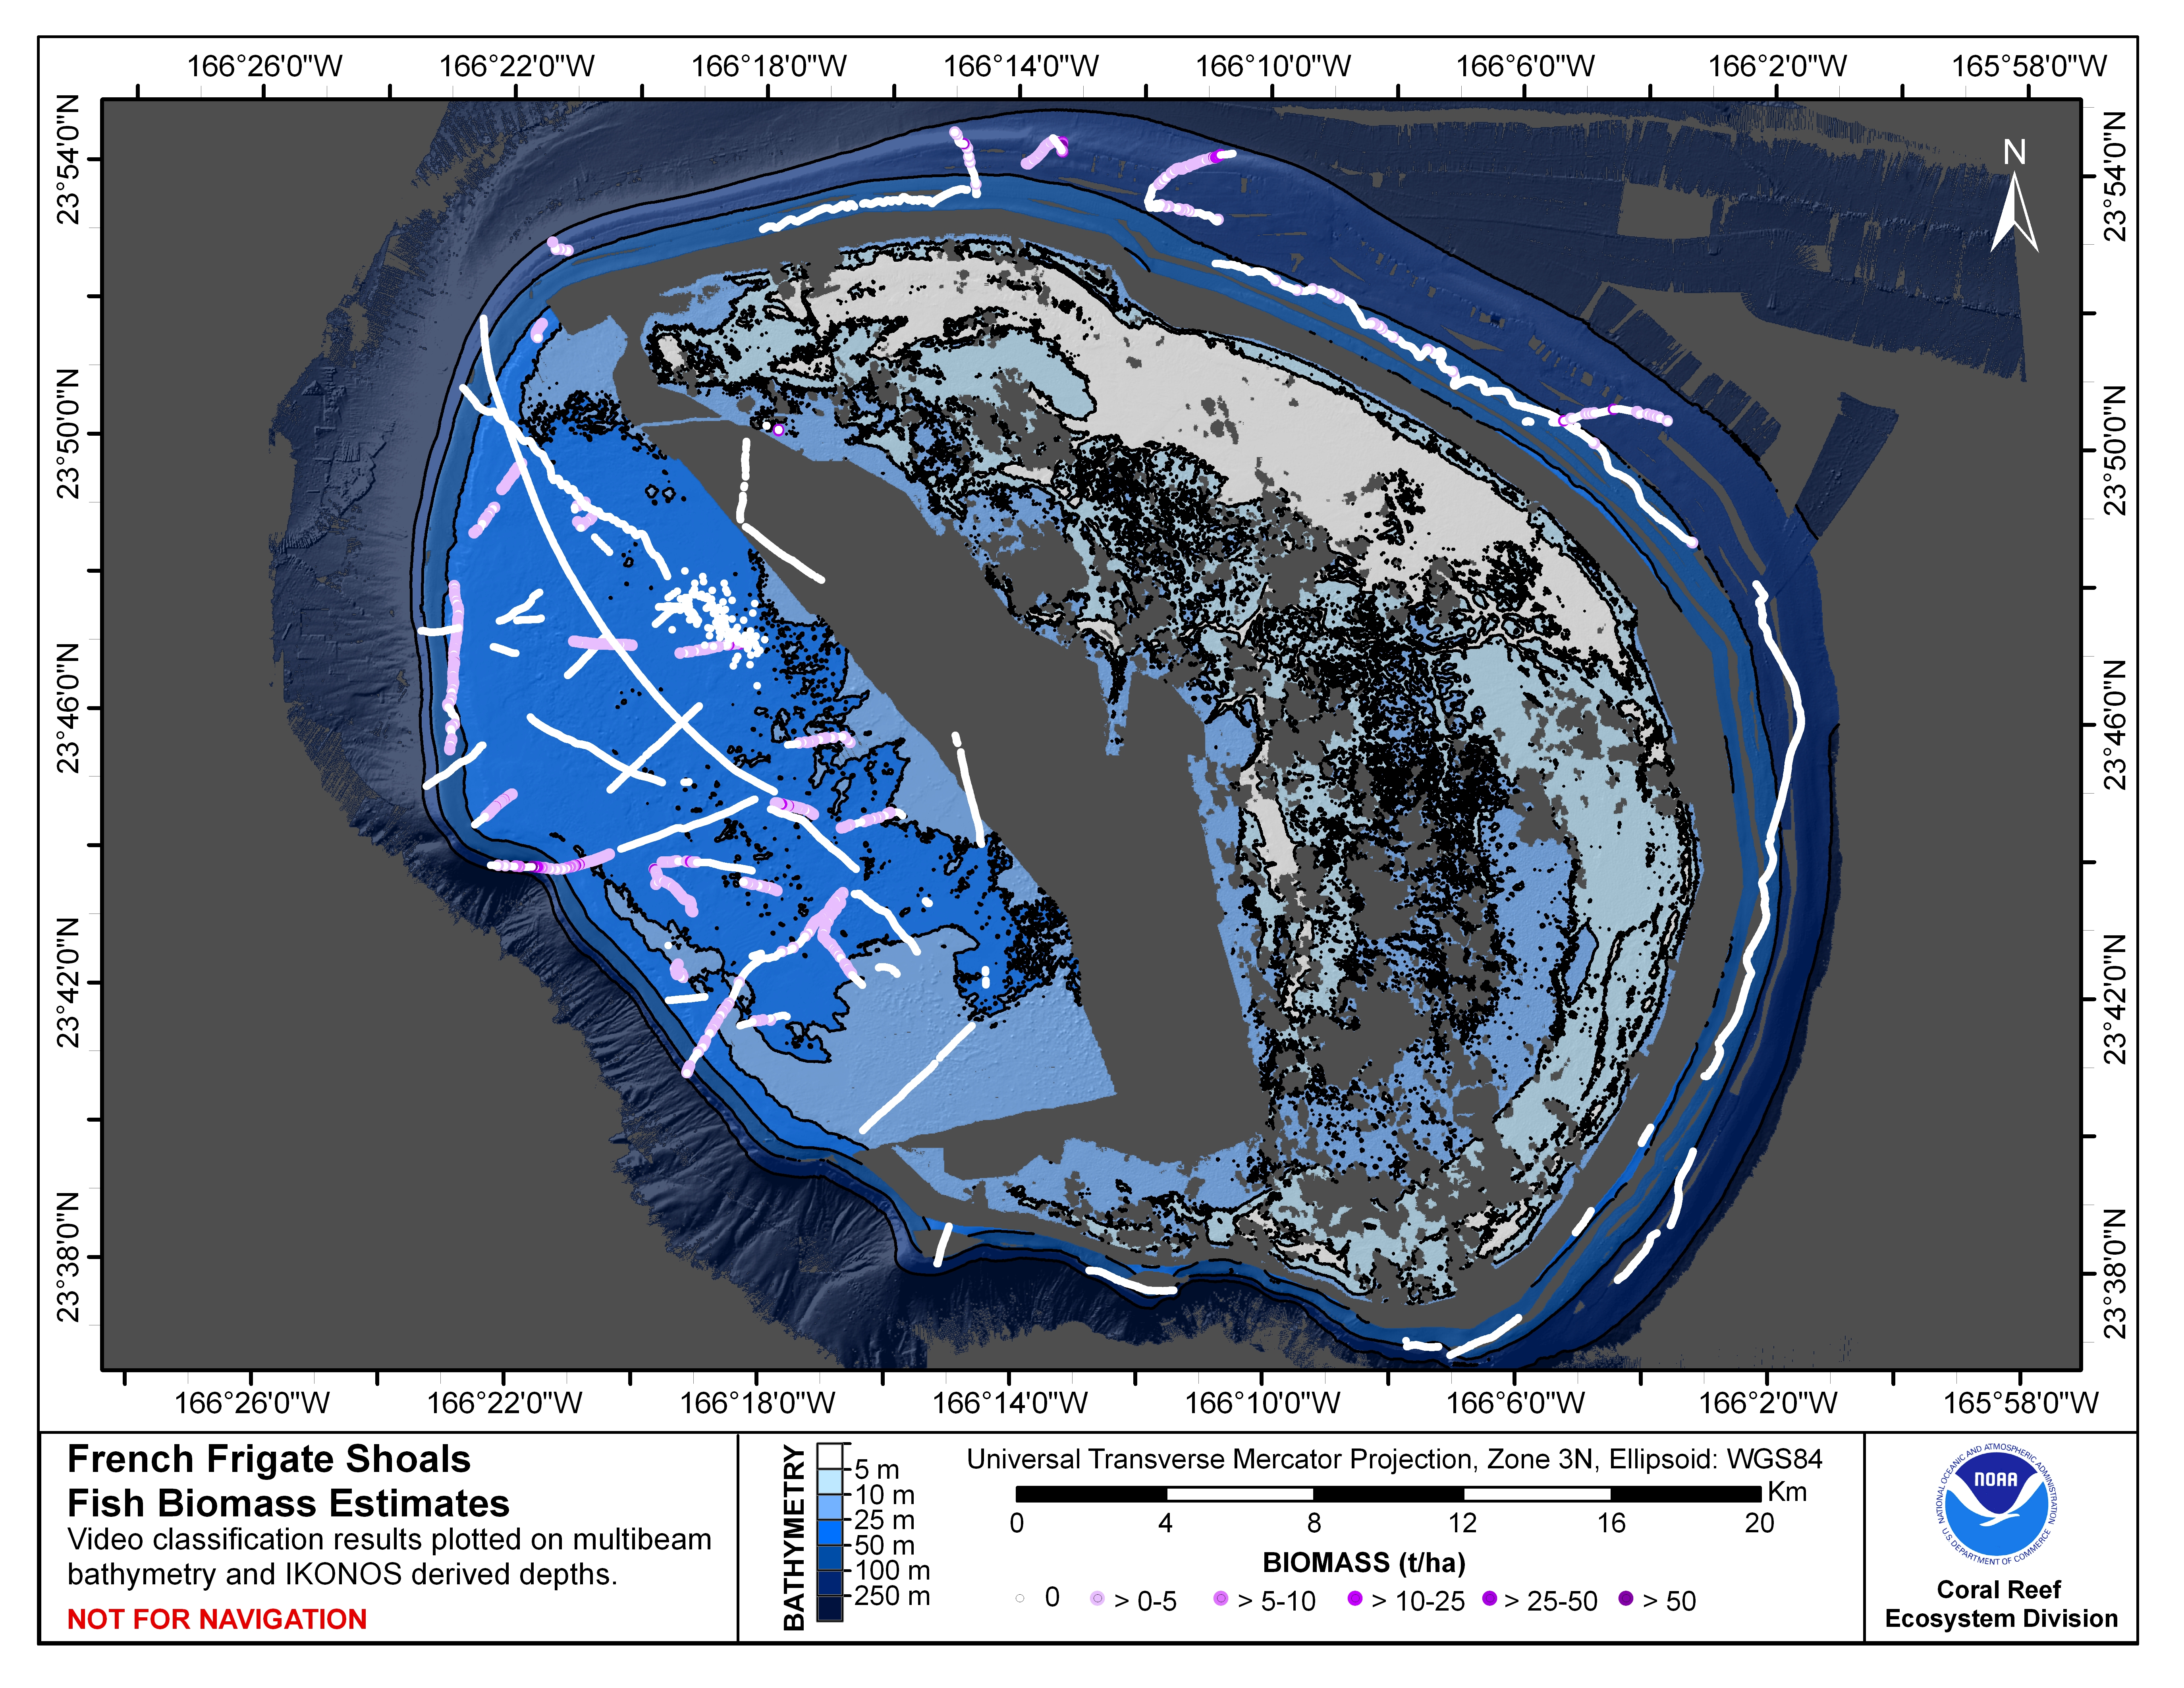
The map above shows total fish biomass from towed camera sled (TOAD) videos collected at French Frigate Shoals in 2001, 2002, 2003, 2004, 2005 and 2008. Optical data from 2001, 2002, and 2003 collected as still photographs were not suitable for mobile fauna classification and therefore are not included. Each point represents a thirty second video interval centered around a location derived from points classified in the optical validation maps. Note that size classes are unevenly distributed to minimize in-class variability.
The mobile fauna data contain biomass estimates as well as the numbers of fish which make up that total biomass (tonnes/hectare). Although the mobile fauna maps present biomass, fish numbers can be found in the underlying shapefiles (see layer file description for instructions). This enables users to obtain a more detailed understanding of the distribution of fish assemblages. Benthic classifications associated with these data can be downloaded with the other Optical Validation data.
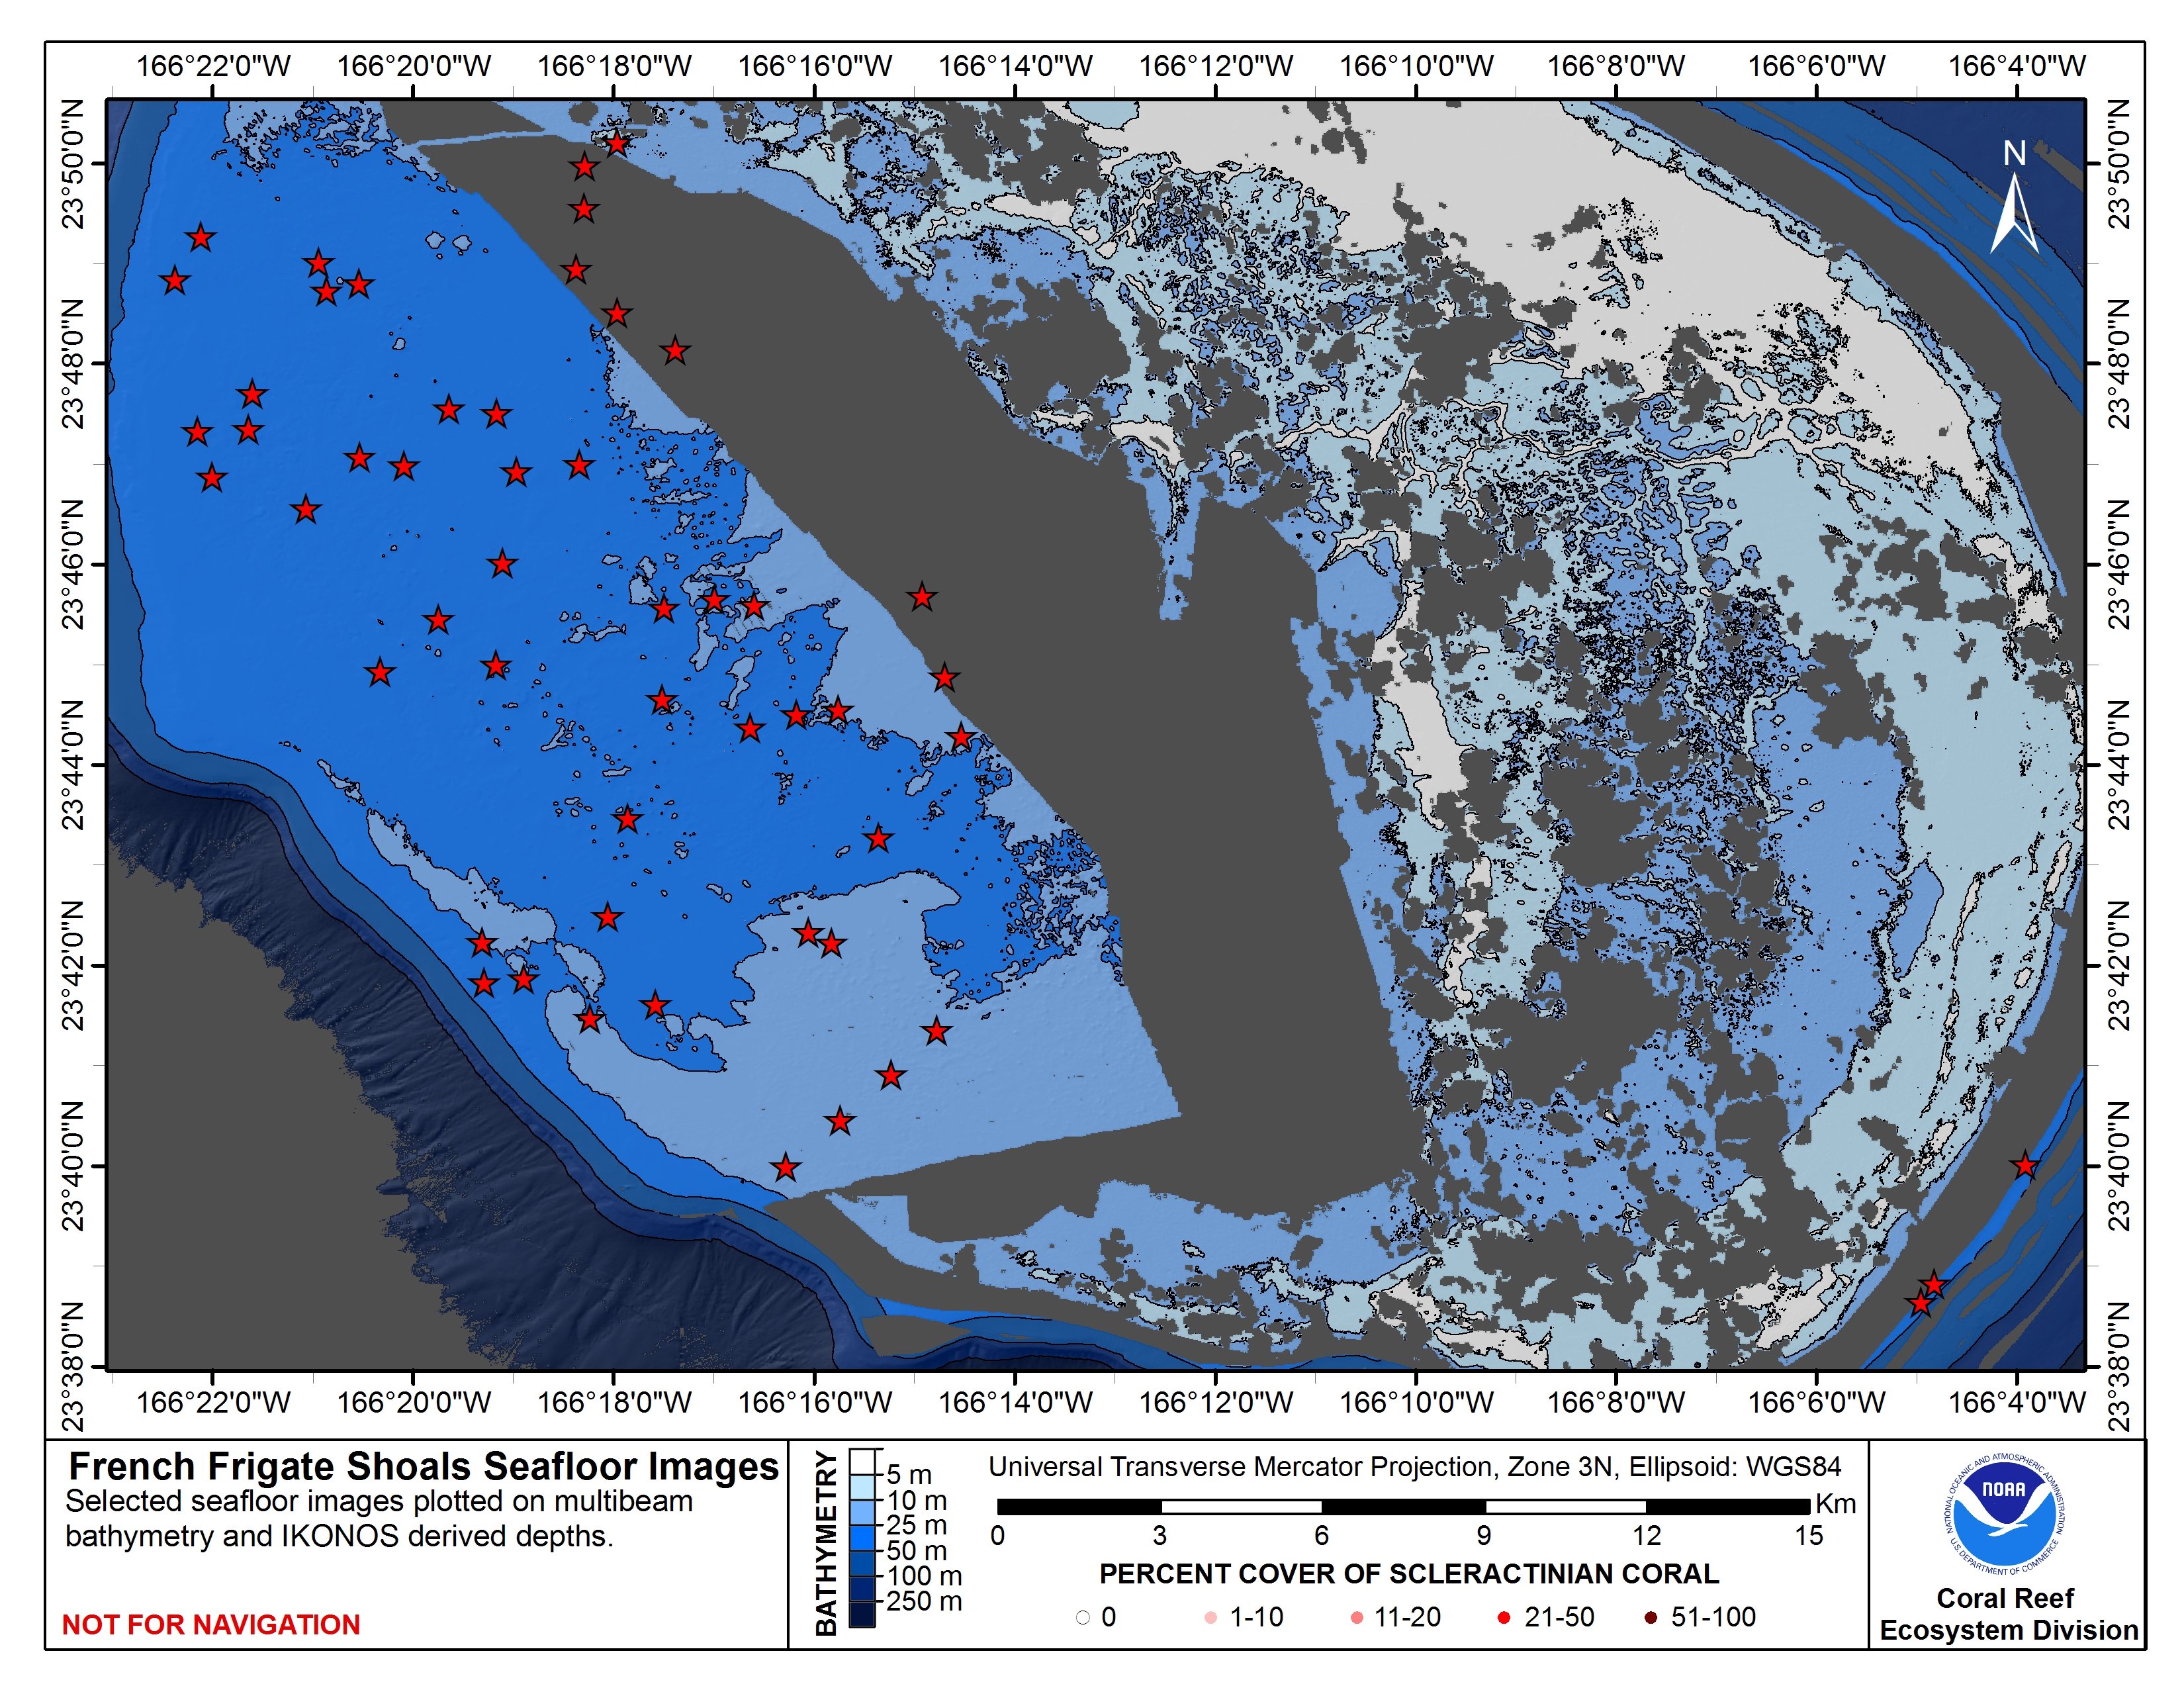
Optical Images
A suite of digital still images and video frame grabs from French Frigate Shoals are available for viewing here. Click on the red dots in the image below to open a high-resolution JPG of the seafloor at that location (image will open in a new window).

Download the above image as a high-resolution JPG.