| The Hawaii Ocean Time-Series is now 12 years long, allowing
us to detect interannual variations in water properties from the near-surface
layer to the bottom (4800 m). Despite the energetic cruise-to-cruise
variations associated with mesoscale eddies, low frequency variability
of temperature, salinity and dissolved oxygen emerge without any sophisticated
data processing.
|
|
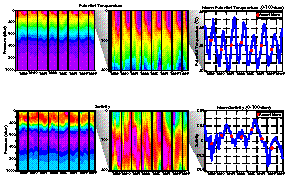
| The dominant interannual signal in the near-surface and near-bottom temperatures is related to the El Niño-Southern Oscillation phenomenon with near-surface variations related to local forcing, and bottom variations related to remote forcing by baroclinic waves. Near-surface salinity reflects more clearly the interannual variations of surface forcing. |  Near surface variability |
 Near Bottom variability |
|
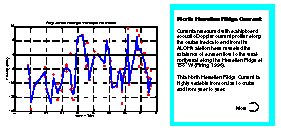
| Currents measured with a shipboard acoustic Doppler current
profiler along the cruise tracks to and from the ALOHA station have
revealed the existence of a mean flow to the west-northwest along
the Hawaiian Ridge at 158°W (Firing, 1996). This North Hawaiian
Ridge Current is highly variable from cruise to cruise and from year
to year.
|

Near Surface Current Variablility
|
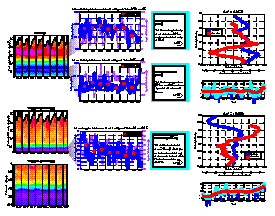
| Within the water column, there are 3 hydrographic features which dominate the mean profiles: These features are the shallow salinity maximum (Smax) in the upper thermocline, the salinity minimum (Smin) associated with the North Pacific Intermediate Water mass, and the dissolved oxygen (dO2 min) associated with the Antarctic Intermediate Water mass. When these features are analyzed on potential density surfaces, variations in conservative properties such as T and S can only be attributed to horizontal advection and diapycnal mixing. Variability associated with advection may be due to current anomalies, or may be due to changes in the remote surface forcing of these features in regions of water mass formation. Our observations cannot distinguish between these two modes of variability. |  Interior Variability |
| So far, the biggest surprises are the detection of ENSO time-scale variability in the near-bottom temperatures, and the trend towards lower values of dO2 in the Antarctic Intermediate Water. That trend may be associated with trends in other properties and other portions of the water column which are masked by other, more energetic, variability. A longer Hawaii Ocean Time-Series will tell. |
|
Home
> Results
> Virtual Poster
