
Surface Layer T&S
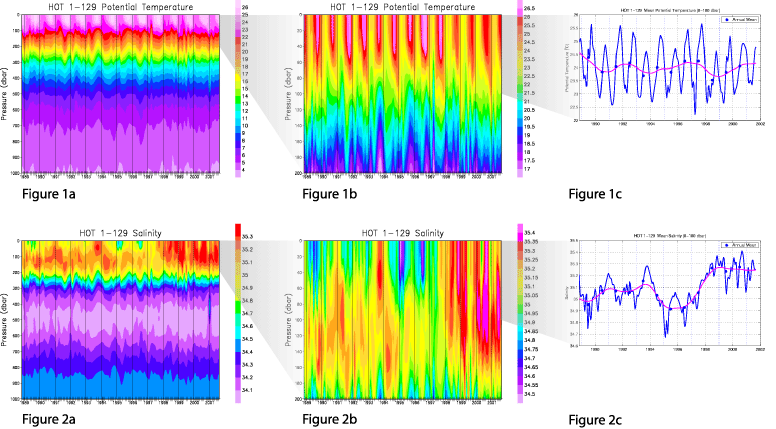
The upper 100 m represents the more-or-less active part of the upper ocean with respect to interaction with the atmosphere. Thus, it is expected that the average temperature and salinity in this layer would reflect climate anomalies, and this is the case. Some of these variations can be associated with local wind anomalies related to EL Niño/Southern Oscillation events (cf. Karl et al., 1995; Karl and Lukas, 1996).
Not only does the annual average near-surface temperature vary from year-to-year, but the annual maxima and minima vary markedly (Fig. 1c). For example, 1991 has both the warmest and coldest temperatures in the record, making the range of variation maximal for that year. Smallest ranges are seen for 1993 and 1995.
Salinity in this near-surface layer does not show a seasonal cycle (Fig. 2c), unlike the pronounced seasonality of temperature. Instead, pronounced interannual variation is observed, with relatively salty conditions in 1990-91, 1993, and 1995, with relatively fresh conditions in 1989, late 1991, and early 1995.
The only correlation that can be seen between T and S is that the saltiest conditions are aligned with the coolest annual maxima in 1990, 1993, and 1995. This might be due to windier than normal conditions and increased evaporation and mixing.