[ Bathymetry | Backscatter | Optical Validation | Geomorphology ]
Maro Reef Composite Backscatter Imagery

Download above image as a high-res JPG or high-res PDF
Maro Reef Color Composite Backscatter Imagery
 |
 |
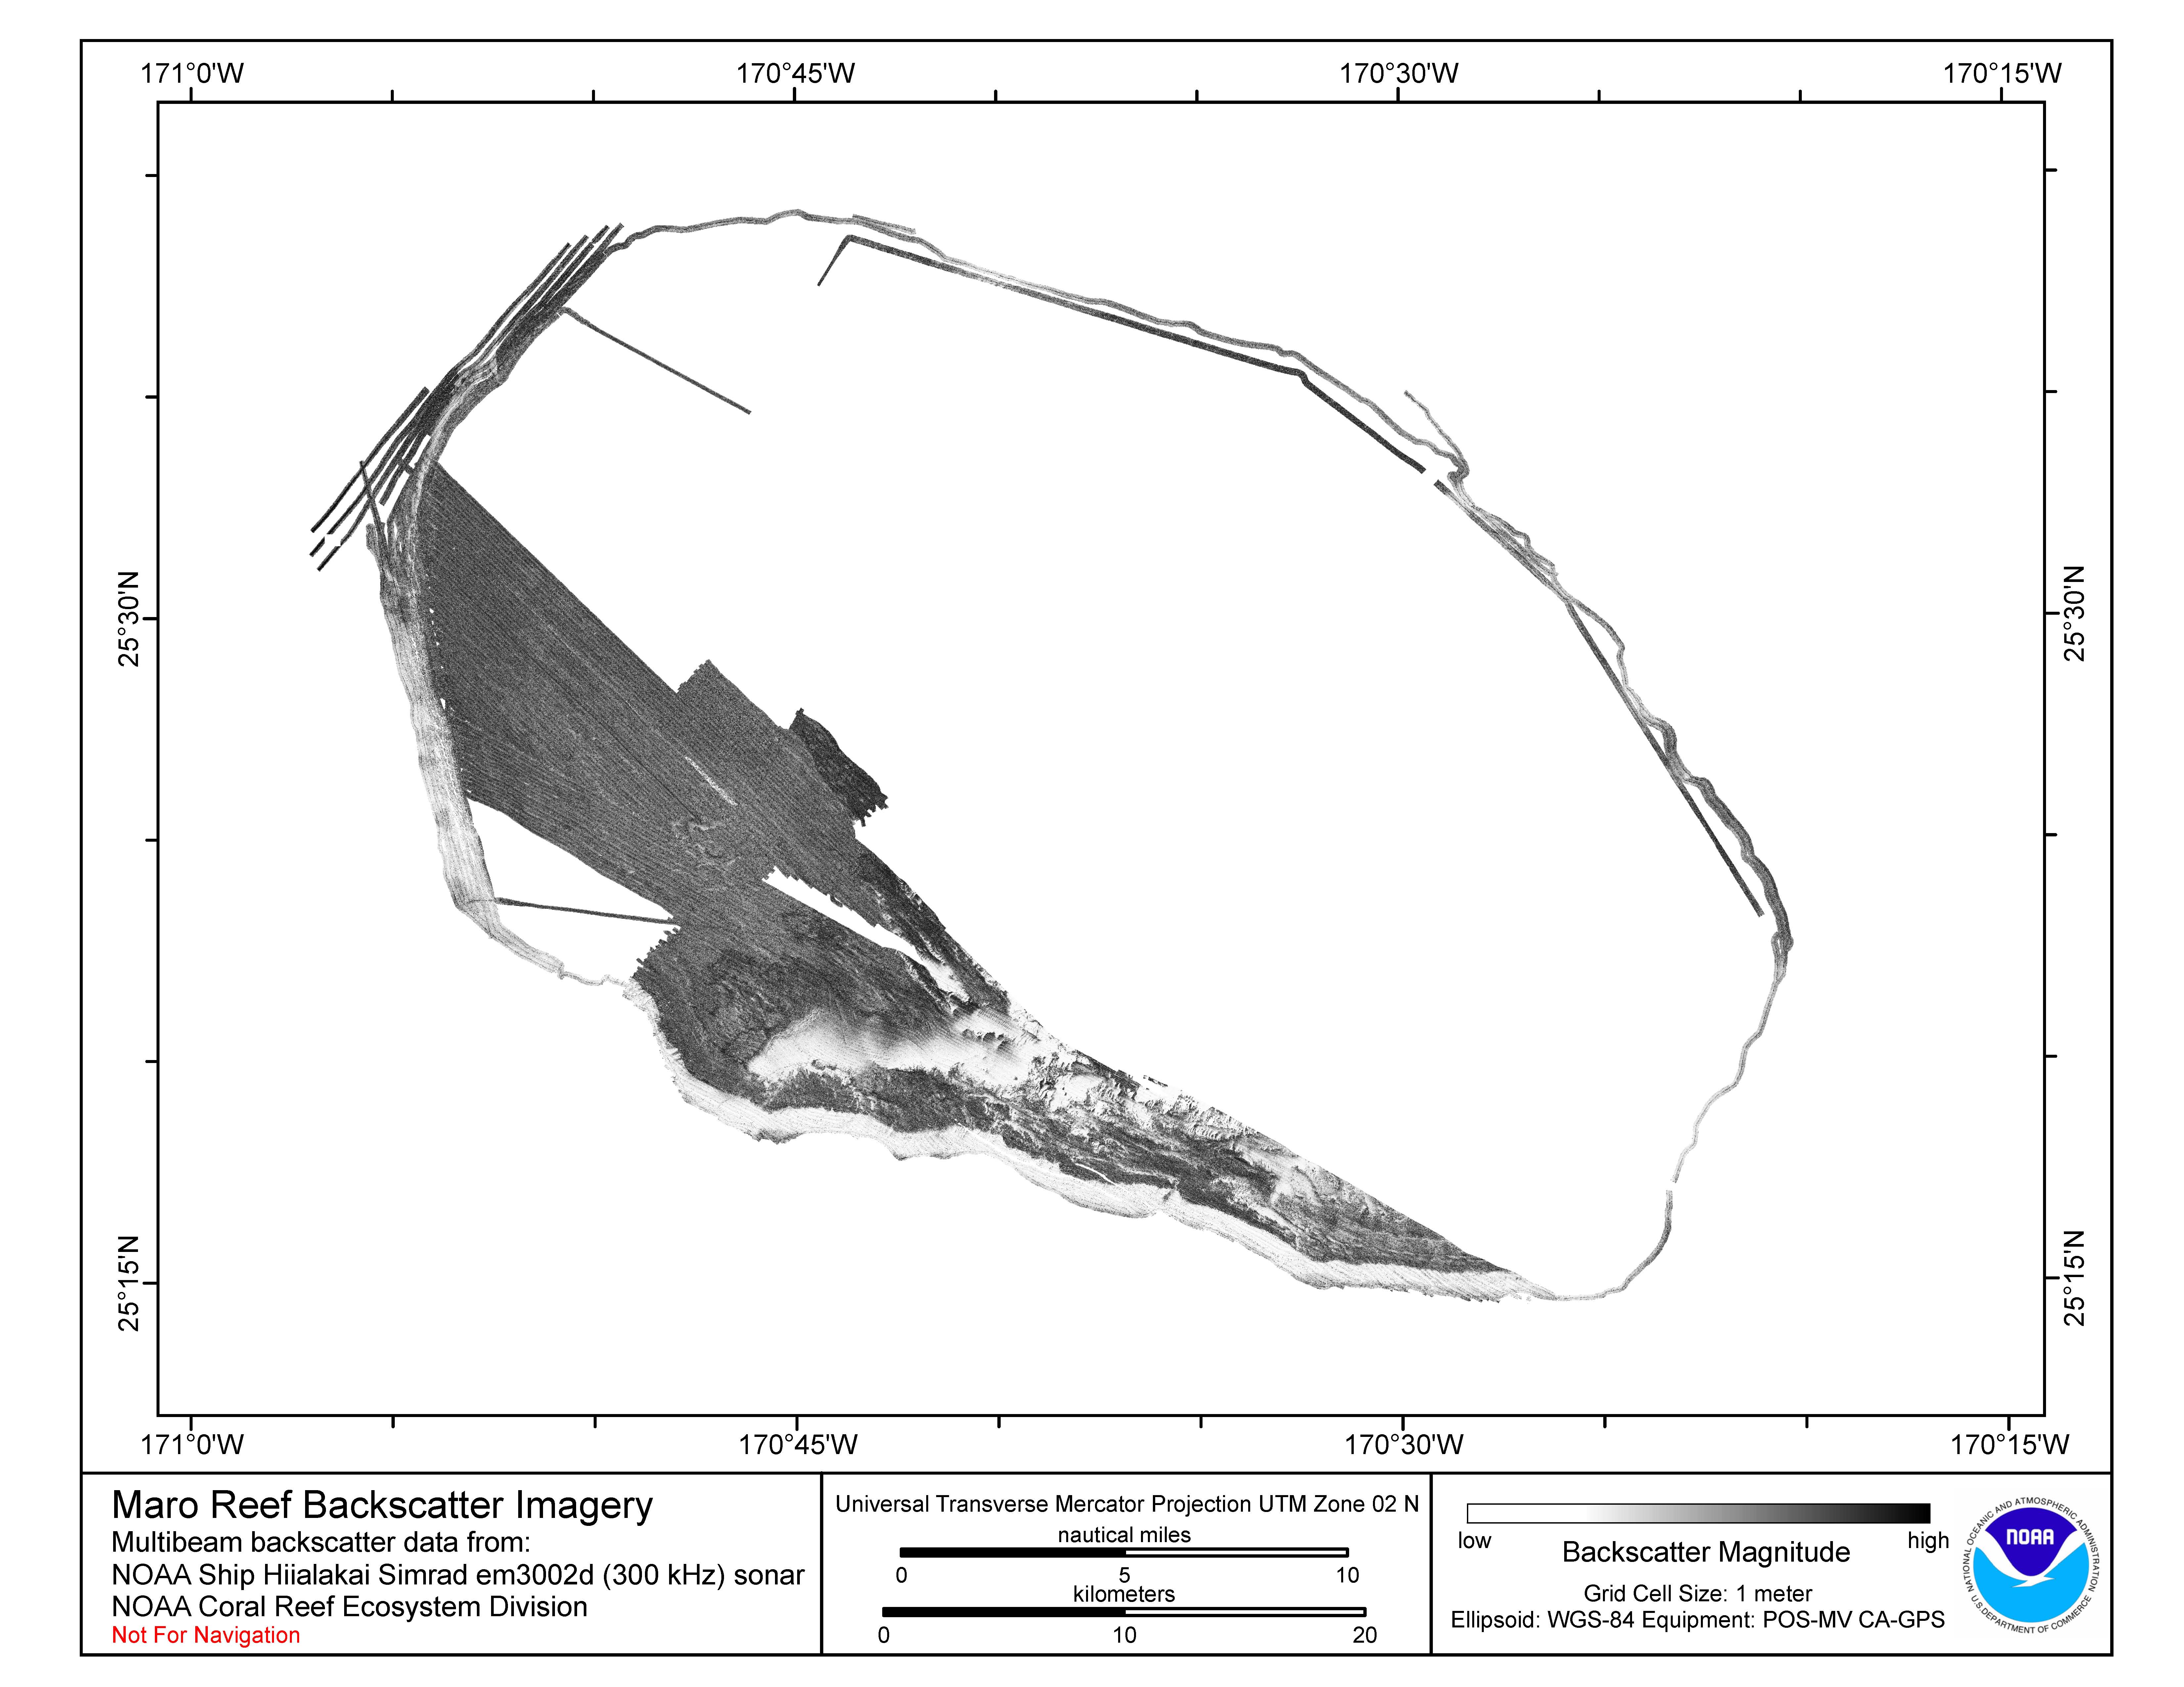
Download above image as a high-res JPG or high-res PDF
Zipped data files contain 1) grid data file (ASCII), 2) high-res JPG of image, and 3) explanatory metadata text file (identical to linked file listed below). Study area grids are named for the island location, the type of sensor used for data acquisition, the chart box number, and the grid resolution in meters.
AHI Reson 8101 240 kHz Backscatter Imagery

| Download above image with boxes as a high-res JPG or high-res PDF Download above image without boxes as a high-res JPG or high-res PDF The boxes on the map represent charts used to grid subsets of the backscatter data into manageable file sizes. The box labels correspond to the 1 meter GeoTIFFs that are available for download in the pull down menus. To create a map of the entire backscatter dataset, all charts must be downloaded and the data must be mosaicked. The 30 meter GeoTIFF are available for download as a single grid, numbered 25-01. Reson 30 m grid: GeoTIFF metadata text |
|
| Reson 1 m grid: GeoTIFF metadata text | |
Top of the page
Hi‘ialakai Simrad EM3002d 300 kHz Backscatter Imagery

| Download above image with boxes as a high-res JPG or high-res PDF Download above image without boxes as a high-res JPG or high-res PDF The boxes on the map represent charts used to grid subsets of the backscatter data into manageable file sizes. The box labels correspond to the 1 meter GeoTIFFs that are available for download in the pull down menus. To create a map of the entire backscatter dataset, all charts must be downloaded and the data must be mosaicked. The 30 meter GeoTIFF are available for download as a single grid, numbered 65-01. EM3002d 30 m grid: GeoTIFF metadata text |
|
| EM3002d 1 m grid: GeoTIFF metadata text | |
Top of the page
Hi‘ialakai Simrad EM300 30 kHz Backscatter Imagery

| Download above image with boxes as a high-res JPG or high-res PDF Download above image without boxes as a high-res JPG or high-res PDF The boxes on the map represent charts used to grid subsets of the backscatter data into manageable file sizes. The box labels correspond to the 1 meter GeoTIFFs that are available for download in the pull down menus. To create a map of the entire backscatter dataset, all charts must be downloaded and the data must be mosaicked. The 30 meter GeoTIFF are available for download as a single grid, numbered 100-01. EM300 30 m grid: GeoTIFF metadata text |
|
| EM300 1 m grid: GeoTIFF metadata text | |
Kilo Moana Simrad EM120 12 kHz Backscatter Imagery

| Download above image as a high-res JPG or high-res PDF
The data for the above map are available as a single grid. Use the pulldown menus to download the data set of your choice. EM120 30 m grid: ASCII metadata text |
|