DROUGHT IN THE PACIFIC
Drought is a regular and significant feature of the climate of the Pacific Islands and can have severe impacts on hydrological, ecological, agricultural, and socioeconomic systems. The most prominent driver of drought in this region is the El Niño-Southern Oscillation. For many islands, El Niño typically results in extended drought conditions, which can lead to drinking water shortages and increase the area burned by wildfires, sea level decreases, severe impacts to coral reefs, enhanced risk of damaging tropical cyclones, and possible spread of vector-borne disease and illness. Low islands are especially prone to drought due to their limited capacity to store fresh water, and with thin aquifers, they are highly sensitive to the impacts of saltwater intrusion.

Pacific Island peoples have endured drought for millennia, and have developed technological and cultural strategies for responding to droughts. According to Hawaiian oral traditions, dryland agricultural systems were particularly vulnerable to droughts, with some political upheavals linked directly to devastating droughts. In the recent past, droughts have reduced crop yields, lower livestock production, and reduced streamflow and reservoir water levels. In turn, these changes had driven the depletion of groundwater resources and increased the extent and severity of wildland fires, with damage to terrestrial, aquatic, and nearshore habitats. Collectively, these effects translate into substantial economic losses. Droughts, or even dry spells, can also contribute to conflicts between agricultural and other instream water users.
Droughts vary in duration, frequency, extent, and severity. Recent trends have found that drought duration and magnitude in Hawaii have significantly increased: that is, droughts are lasting longer and getting more severe. The two worst droughts in the past century for Hawaii were 1998-2002 and 2007-2014, with widespread effects across all islands.
This figure to the left shows Hawai‘i state drought frequency (a; number of events), total drought duration (b; number of months), and total drought magnitude (c; unitless) by decade from 1920–2019. Statewide trends are shown for the 6-month Standardized Precipitation Index (SPI-6; darker colors, dashed trend line) and the 12-month Standardized Precipitation Index (SPI-12; lighter colors, solid trend line). p < 0.05 indicated with asterisk *. Source: Frazier et al. 2022.
This figure to the right shows droughts identified from the Hawai‘i statewide average 12-month Standardized Precipitation Index (SPI-12) time series from 1920-2019. Intensity (absolute value of SPI values), peak intensity, average intensity, magnitude, and percent area in moderate drought or worse (SPI < -1) are shown for each drought; magnitude and percent area are shown on reverse axis. Source: Frazier et al. 2022.
 This figure to the left shows Hawai‘i drought maps based on SPI-12 for the two worst droughts: (a) 2007–2014; (b) 1998–2002. The color indicates the weighted proportion of drought intensity (mild drought in yellow to extreme drought in dark red). The size of points indicates the proportion of time spent in drought (smallest points: 0–25% time in drought, largest points: 85–100% time in drought during drought years). Source: Frazier et al. 2022.
If you notice any drought impacts – submit a report to the U.S. Drought Monitor! They use these impact reports from the public to help them make the Drought Monitor map each week. You can also look up past impacts that have been reported in their archive. See links below:
Submit a Condition Monitoring Observer Report: https://droughtimpacts.unl.edu/Tools/ConditionMonitoringObservations.aspx
State Impacts Archive: https://droughtmonitor.unl.edu/DmData/StateImpacts.aspx
Other Drought Impact Tools: https://droughtimpacts.unl.edu/Tools.aspx
Management
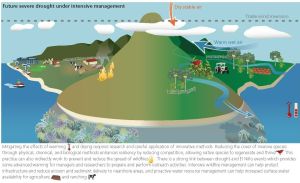
Effective drought management can limit the impacts of drought, reduce wildfire risk, protect native species, and sustain the delivery of goods and services that support ecosystems and society. Drought exerts impacts from ridge-to-reef, on upland forests, agricultural systems, human communities, and coastal nearshore areas, requiring holistic, multi-generational approaches to ridge-to-reef land management.
Above graphics source: 2017 Pacific Islands Climate Adaptation Science Center Newsletter https://pi-casc.soest.hawaii.edu/wp-content/uploads/2021/01/Pacific-Islands-CSC-Drought-Newsletter.pdf
CURRENT U.S. DROUGHT MONITOR CONDITIONS FOR HAWAIʻI
The U.S. Drought Monitor (USDM) is updated each Thursday to show the location and intensity of drought across the country. This map shows drought conditions across Hawaiʻi using a five-category system, from Abnormally Dry (D0) conditions to Exceptional Drought (D4). The USDM is a joint effort of the National Drought Mitigation Center, USDA, and NOAA.
The following state-specific drought impacts were compiled by the National Drought Mitigation Center. While these impacts are not exhaustive, they can help provide a clearer picture of drought in Hawaiʻi.
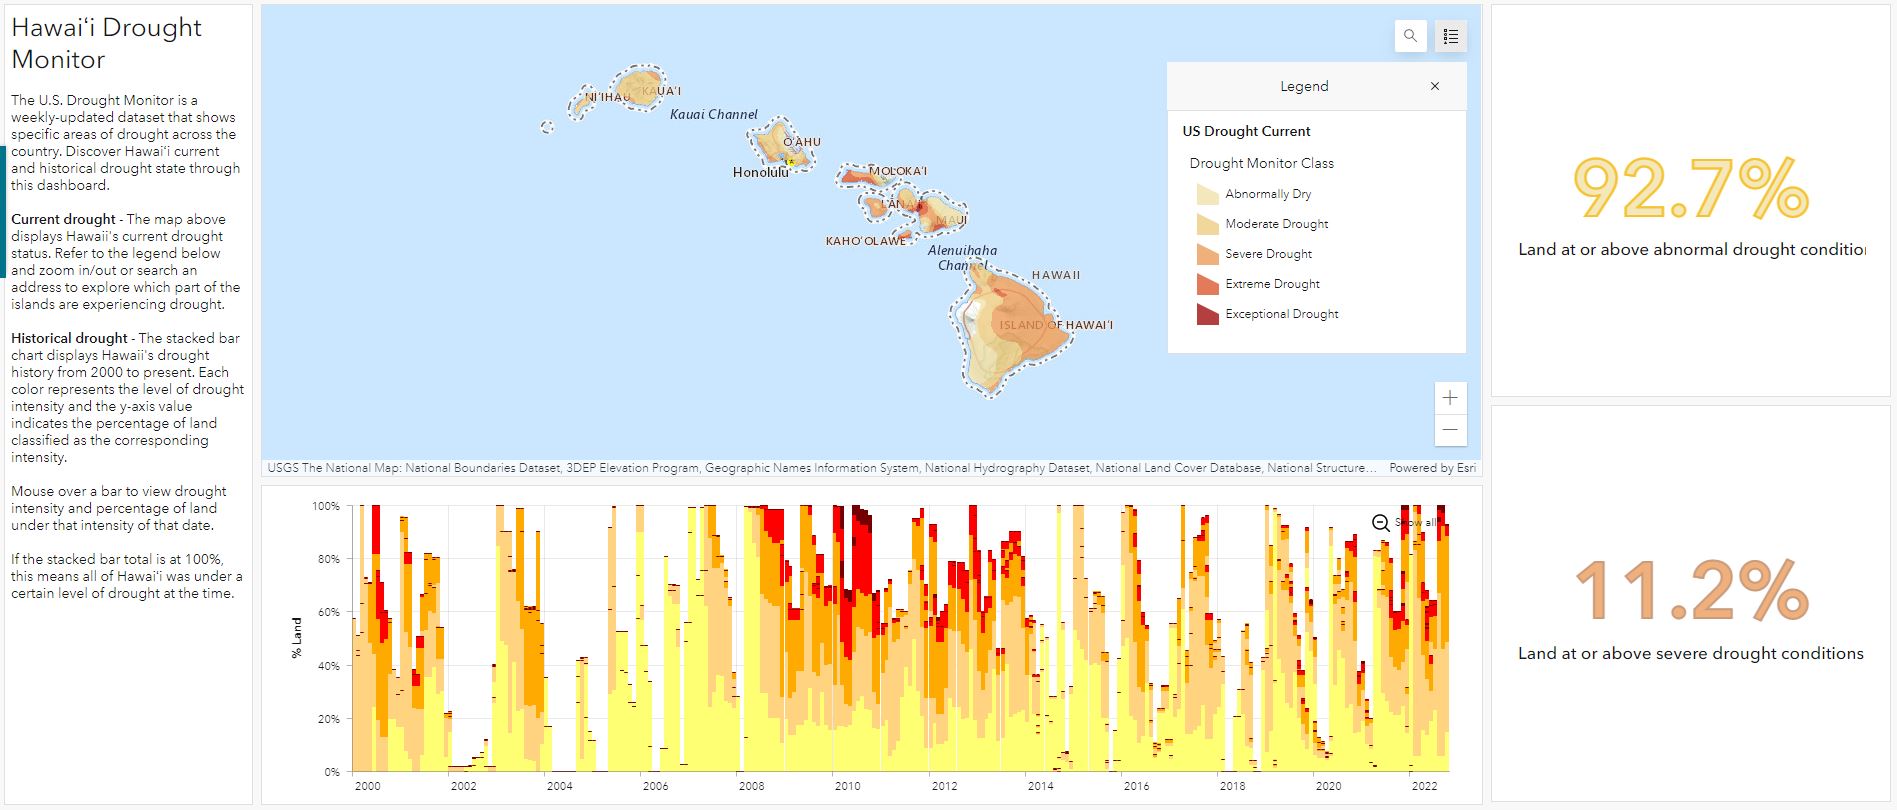
HAWAIʻI DROUGHT MONITOR
The U.S. Drought Monitor is a weekly-updated dataset that shows specific areas of drought across the country. Users of the Hawaiʻi Drought Monitor (static snapshot pictured below) can discover Hawaiʻi’s current and historical drought states through the dashboard.
HUMAN DIMENSIONS OF DROUGHT
This project by the Pacific RISA is summarized by “Drought is a part of the natural climate cycle and will continue to occur in Hawaiʻi. To prepare optimally, agricultural decision makers need to consider drought impacts on both natural and human systems. However, information about drought risk perceptions, experiences, and responses are not quantified easily. In this study we used qualitative research methods to assess the human dimensions of drought impacts among farmers, ranchers, and service providers in the agricultural sector in Hawaiʻi. The specific aims were to: (1) Describe mental models of drought risk, with a focus on identifying specific socio-cultural impacts; and (2) Identify links between drought mental models and planning and management activities.”


