Fernando Santiago-Mandujano
22 January 1999
Pressure effect correction on CTD temperatures
A small, previously unaccounted for pressure effect on the temperature sensors that affected all of our measurements was identified at Sea-Bird Electronics Inc. (N. Larson, personal communication, June 1996). This effect is due to residual stress transmitted to the thermistor bead through the protective metal sheath. Pressure tests conducted at Sea-Bird yielded correction factors (k) for this effect for each of our sensors (Table 1). The corrected temperatures (Tc) are calculated from the sensor temperature (T) and the pressure (P) as: Tc=T-k*P. This correction (which is insignificant at levels other than in the deep and bottom waters) has been applied to all the CTD data from HOT cruises prior to 1997 (HOT-1 through HOT-78), and the correction has been implemented in our routine CTD processing programs since 1997.
Table 1. Correction factors for residual pressure effect on temperature.
Sensor # Pressure correction coefficient (k) 741 -0.28 x 10⁻³ °C / 5000 dbar 886 -0.11 x 10⁻³ °C / 5000 dbar 1416 1.17 x 10⁻³ °C / 5000 dbar 1591 1.44 x 10⁻³ °C / 5000 dbar 2202 0.83 x 10⁻³ °C / 5000 dbar 2242 0.33 x 10⁻³ °C / 5000 dbar
The maximum correction to the 1996 cruises temperatures was 1.4 x 10⁻³ °C needed for the deeper portion of the near-bottom casts. For the majority of the casts, which only reached 1020 dbar this correction had a maximum value of 0.3 x 10⁻³ °C. Casts from cruises before 1996 required a correction of the same order of magnitude. Note that sensors 741 and 886, which have been used most frequently during HOT cruises have the smallest pressure correction among all our sensors.
Since salinity is calculated as a function of CTD temperature, pressure and conductivity, the pressure effect on temperature also affected the salinity calculations. In addition, since CTD conductivities are calibrated against bottle salinities on a per cruise basis, an error was introduced in the calibrations when bottle conductivities were back-calculated from the bottle salinities and the uncorrected CTD temperatures. After correcting for these effects, the salinities differ from the uncorrected ones by a maximum of 0.9 x 10⁻³ in the deeper portion of the near-bottom casts. For casts reaching only 1020 dbar the associated salinity correction is less than 0.3 x 10⁻³.
The corresponding effect on the CTD-calculated density has a maximum
value of 0.8 x 10⁻³  in the deep portion of the near-bottom
casts. For casts reaching only 1020 dbar the effect is less than
0.2 x 10⁻³
  .
.
Viscous heating effect on CTD temperatures
Another correction to our temperature measurements was due to viscous heating of the sensor tip due to the water flow around it (Larson and Pederson, 1996). The viscous heating is a function of the square of the water velocity past the temperature sensor (U2), and the kinematic viscosity of the water (nu). The expression for the viscous heating varies depending on the shape of the TC duct that conducts water through the temperature sensor because this shape causes a flow development at the duct intake that modifies the theoretical dependence on U2. The expression for the heating was obtained from fits to actual heat measurements conducted at SeaBird for the two types of TC ducts used during the HOT program, identified here as 'white' and 'clear' (N. Larson, personal communication, 1996). The 'white' TC duct was used during cruises HOT-11 through 53, and the 'clear' TC duct has been used during cruises after HOT-53.
All cruises after HOT-53 have used the same pair of CTD pumps and the 'clear' TC ducts. For the 'clear' duct the temperature increase due to viscous heating was given by Tvh = 0.466*sqrt(nu)*U2. The water flow through our CTD plumbing systems was measured in our lab. A mean flow of 25.69 ml/s (with 0.30 ml/s standard deviation from 7 measurements) was obtained for the first sensor set, and 25.67 ml/s (with 0.31 ml/s standard deviation from 7 measurements) for the second set. The TC duct has a cross section area of 0.29172 cm2, which resulted in a water velocity of U = 0.88 m/s for both sensor sets. The kinematic viscosity was calculated as a function of temperature and density interpolating through discrete values from a table from Sverdrup et al. (1946, p. 69).
The maximum viscous heating correction on profiles after HOT-53 was 0.5 x 10⁻³ °C. Cruises 11 to 53 utilized a different pump and the 'white' TC duct, and required a larger viscous heating correction. The correction for the 'white' TC duct is given by Tvh = 0.40*sqrt(nu)*U2. The TC duct had a cross-section area of 0.11868 cm2, and the mean flow was 26 ml/s (N. Larson, personal communication, 1996), yielding a value of U = 2.19 m/s. The magnitude of this correction near the bottom at station ALOHA is Tvh = 2.5 x 10⁻³ °C (using a kinematic viscosity nu of 1.7 x 10⁻⁶ m2/s).
The effect of the viscous heating correction on our CTD-calculated
salinity during the 1996 cruises was less than 0.03 x 10⁻³ which is inconsequential. This effect is very small because both the corrected
and uncorrected CTD salinities were calibrated against the same bottle
salinities. The difference is due to the effect of the temperature
correction on the back-calculated bottle conductivities from bottle
salinity and CTD temperature, needed to calibrate the CTD
conductivities. The viscous heating correction does not have a major
effect on this calibration because its effect is nearly constant for
all the water samples used for calibration (it only varies slightly due
to the kinematic viscosity). On the other hand the pressure effect on
temperature described above has a larger impact on this calibration
because it varies for each water sample depending on its pressure. The
final result is a larger effect on the CTD salinities as compared to
the viscous heating (up to 0.9 x 10⁻³ in the deep casts as seen
above).
The viscous heating effect on the CTD-calculated density during the
1996 cruises had a maximum value
of 0.55 x 10⁻³  .
.
All the CTD temperatures from cruises HOT-11 through HOT-78 have been corrected for the viscous heating effect, and the correction has been implemented in our routine CTD processing programs since HOT-79 (January 1997).
Cruises 1 to 10 were conducted with a CTD system that did not include a TC duct and plumbing system to circulate the water through the sensors at a constant speed. Therefore the water flow around the temperature sensor was highly variable as is typical of most CTD systems. A viscous heating correction for the casts during these cruises was not applied. Only the pressure effect correction was applied for these cruises.
Combined effect of pressure and viscous heating on CTD data.
The effect of the combined corrections from pressure effect and viscous heating on temperature, salinity and density was evaluated comparing the corrected and uncorrected deep profiles from cruises HOT-53 and -56. The cast from cruise HOT-53 was selected because it used the 'white' TC duct that required a larger viscous heating correction than the one used during subsequent cruises. The cast from cruise HOT-56 was selected because it utilized temperature sensor 1591, which has the largest pressure correction among all of our sensors (see Table 1). Therefore, the following results show an upper bound for the combined effect of the pressure and viscous heating effects on the HOT cruises. Cruises between HOT-11 and HOT-53 utilized the 'white' T-C duct, and sensors 741 or 886 that have a small pressure effect correction.
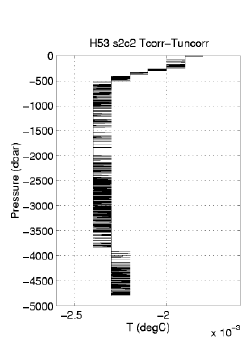
The corrected-uncorrected temperature differences from the deep cast of
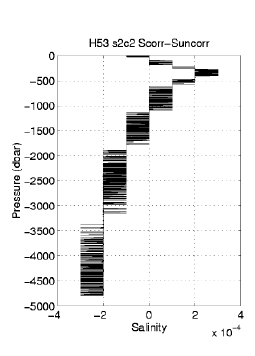
HOT-53 show mainly the effects of the viscous heating correction (Fig.
1). The temperature differences are between -2 and -2.5 x 10⁻³ °C
and nearly constant below 500 dbar (Fig. 1a). The corresponding
salinity differences vary between 0.3 x 10⁻³ at 400 dbar and
-0.3 x 10⁻³ near the bottom (Fig. 1b). Densities vary from 0.7 x 10⁻³
 near 400 dbar to -0.1 x 10⁻³
  near the bottom
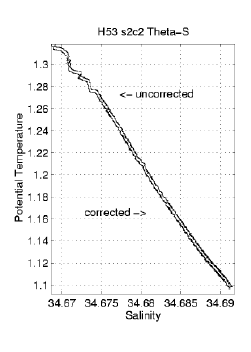
(Fig. 1c). A section of the corrected and uncorrected Potential
temperature/Salinity plots shows the effects of the correction (Fig.
1d).
FIGURE 1.
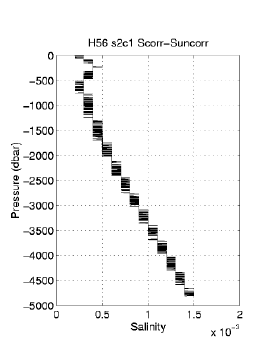
Similar plots for the deep cast of HOT-56 show mainly the effects of
the pressure effect correction (Fig. 2). The temperature differences
vary almost linearly from -0.3 x 10⁻³ °C near the surface to nearly
-2 x 10⁻³ °C near the bottom (Fig. 2a). The salinity differences
vary from about 0.3 x 10⁻³ near the surface to 1.5 x 10⁻³ near the
bottom (Fig. 2b). The corresponding density varies from 0.3 x 10⁻³
 near the surface to nearly 1.5 x 10⁻³
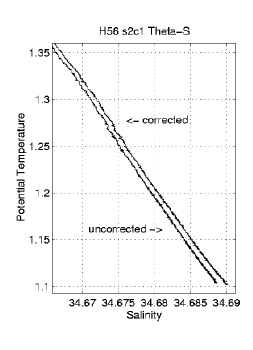
  near the
bottom (Fig. 2c). A section of the corrected and uncorrected Potential
temperature/Salinity plots shows the effects of the correction (Fig.
2d).
The stepwise shape in plots a, b and c in figures 1 and 2 is due to the limits of precision in the measurements. Only four decimal digits in temperature and salinity are reported in the processed CTD files.
FIGURE 2.
References
Larson, N, and A. M. Pederson, 1996. Temperature Measurements in flowing Water: Viscous Heating of Sensor Tips. 1st IGHEM Meeting, Montreal. Canada, June 1996.Sverdrup, H. U., M. W. Johnson and R. H. Fleming, 1946. The Oceans, their Physics, Chemistry and General Biology, Prentice-Hall, New York.

