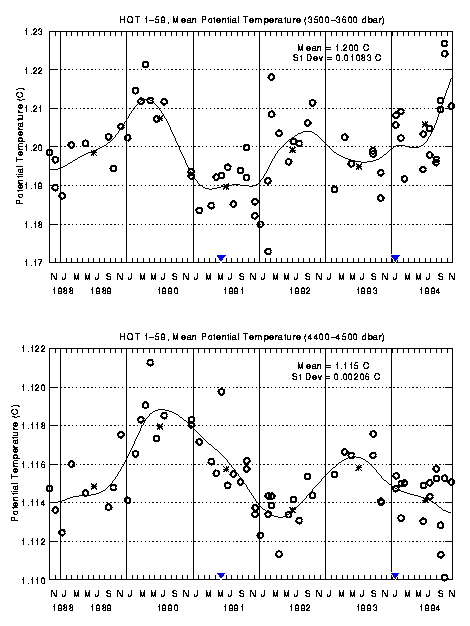
Figure 2. Time series of Deep Water (top panel) and Bottom Water (bottom panel) potential temperature from CTD profiles at the HOT station (circles). The solid line is a cubic spline fit to the temperatures, and the asterisks are the annual mean for each year. The arrowheads along the horizontal axis indicate Bottom Water "overflow" events. See text for definitions and discussion. Note the difference in vertical scales between the top and bottom panels.