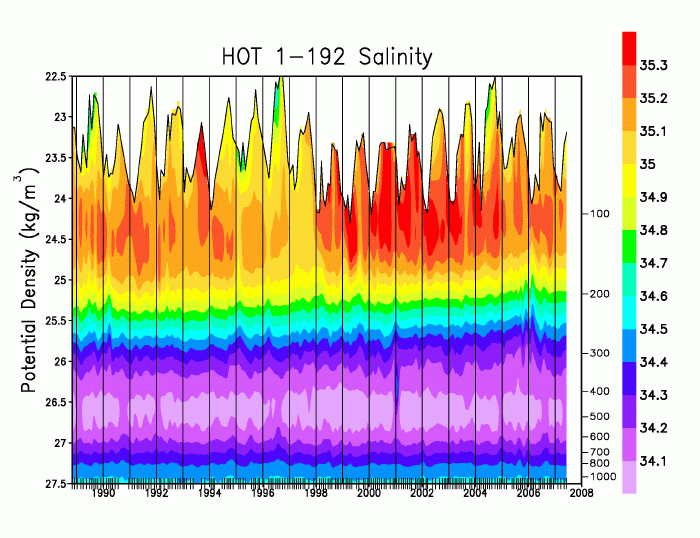
Figure 4. Salinity measured by CTD versus potential density. The average density of the sea surface for each cruise is connected by a heavy line.


Figure 4. Salinity measured by CTD versus potential density. The average density of the sea surface for each cruise is connected by a heavy line.
This material is based upon work supported by the National Science Foundation under Grant No. OCE 9303094, 9811921, 0117919, 0327513, 0752606, 0926766, and 1260164. Any opinions, findings, and conclusions or recommendations expressed in this material are those of the author(s) and do not necessarily reflect the views of the NSF.