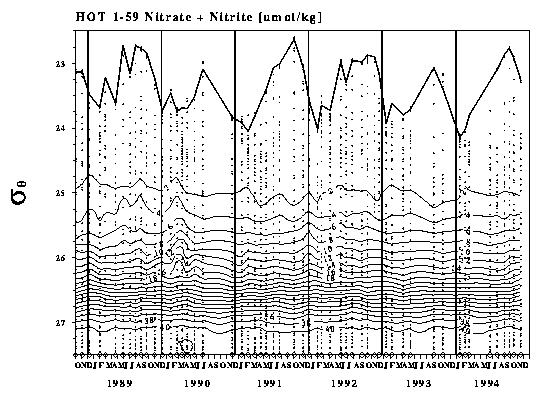
Figure 10. Nitrate plus nitrite from discrete water samples versus potential density. The average density of the sea surface for each cruise is connected by a heavy line. Locations of bottle closures are indicated by solid circles.
Figure 10. Nitrate plus nitrite from discrete water samples versus potential density. The average density of the sea surface for each cruise is connected by a heavy line. Locations of bottle closures are indicated by solid circles.