
RADAR and SONAR: A Primer for the Geophysically-Challenged
Mary MacKay and Stan Zisk
RADAR and SONAR: A Primer for the Geophysically-Challenged
Mary MacKay and Stan Zisk
Remote sensing tools such as radar and sonar allow us to map topography and surficial characteristics of volcanoes and other geologic features in inaccessible (or cloud-covered) locations, including other planets and the seafloor. The following is a brief introduction and comparison of these two systems for those who have familiarity with one but not the other, or who sometimes use radar/sonar data but are a little hazy about where it comes from and what it really means.
The Energy
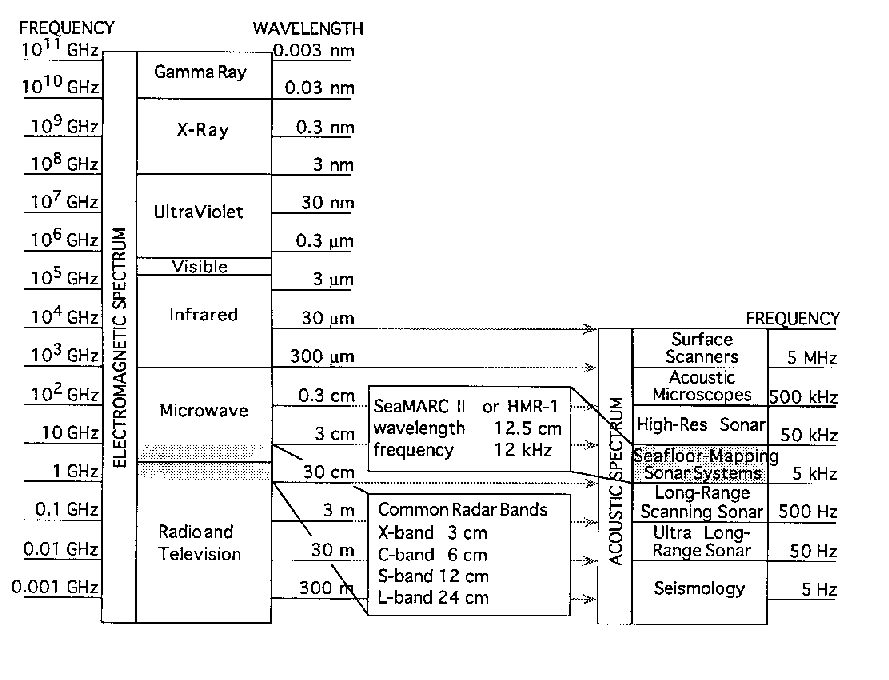 Figure 1. The electromagnetic spectrum,
showing wavelengths for common radar bands and sonar.
Figure 1. The electromagnetic spectrum,
showing wavelengths for common radar bands and sonar.
Both radar and sonar are active systems; they provide a source of energy (electromagnetic and acoustic, respectively) to "illuminate" the terrain and can therefore operate both day and night. Energy returned from the terrain is detected by the system and recorded as imagery. Radar operates at much higher frequencies than does sonar (Fig. 1) and is used to image land areas above sea level (electromagnetic waves are strongly attenuated in water); the lower frequency sonar signal is transmitted through water and is used to image the seafloor.
At the surface being imaged, energy is scattered when there is a sharp change in the propagation of the wave due to a change in the intrinsic properties of the material through which the wave is moving (e.g. from air/water to sediment/rock). Energy is generally scattered in all directions, but not uniformly; there is a very strong echo in the so-called "specular" direction (as in a smooth mirror reflector). The radar/sonar image is composed only of the "backscattered" energy that returns to the receiving array (antenna). The intensity of the backscatter return (and hence the "brightness" of the image) is a function of both the properties of the system and the characteristics of the terrain. By convention, strong backscatter in radar is shown bright (as is GLORIA sonar), whereas in SeaMARC sonar (and its successor, HMR-1) strong backscatter is dark.
The Earth
The terrain attributes that affect the intensity of the backscatter return are texture or roughness, and inherent reflectivity of the surface. For radar, inherent reflectivity of the surface is controlled by the dielectric constant (the property that governs electromagnetic wave propagation). Similarly for sonar, the response to wave propagation is governed by the acoustic impedance. Both the dielectric constant and acoustic impedance are functions of the physical properties of the material, including the porosity, pore fluids, grain composition, and structure. On land, even small amounts of water raise the dielectric constant so that to a first approximation, geologic materials all have about the same reflectivity and surface penetration is low (note that this is not true for desert areas or for planetary bodies such as the Moon that are completely dry). Thus, on earth, the most important terrain characteristic controlling radar/sonar signatures is usually surface roughness.
The Systems
Because backscatter is most strongly influenced by objects comparable in size to 1/2 the source wavelength or larger, the effect of surface roughness on the radar/sonar image is strongly dependent on wavelength. Radar waves travel through air at the speed of light (~3.0x10⁸ m/s) and sonar waves travel through water at the speed of sound (~1.5x10³ m/s). Because of the relationship between velocity, frequency, and wavelength, the higher frequency radar and lower frequency sonar waves have similar wavelengths (Fig. 1). The surficial characteristics that they respond to are therefore in the same general range of 1 to 100 cm .
In addition to wavelength, two other system properties that affect the backscatter response to surface roughness are angle of incidence (measured from the vertical) and polarization. A rough surface produces strong, nearly uniform, backscatter, regardless of incidence angle. In contrast, backscatter returns from smooth surfaces are very angle-dependent; smooth surfaces tend to have very strong backscatter returns at low incidence angles (near vertical), but little or no return at higher angles (Fig. 2). Shorter wavelengths will show less sensitivity to angle than will longer wavelengths because the same surface looks smoother to the longer wavelength system. For radar images, polarization will also affect backscatter intensity (note that sonar uses acoustic compressional waves, which have no polarization attribute; water can not transmit shear waves).
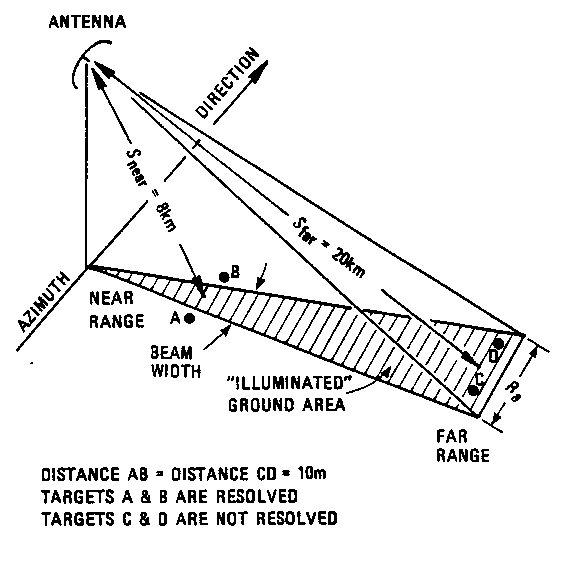 Figure 2. Beam width and resolution in the azimuth direction, Ra, for
real-aperture side-looking radar (SLR) and side scan sonar (distances shown are
for aircraft radar).
Figure 2. Beam width and resolution in the azimuth direction, Ra, for
real-aperture side-looking radar (SLR) and side scan sonar (distances shown are
for aircraft radar).
Side-looking Radar/Sonar
The simplest form of both radar and sonar sends out a single narrow beam and records the signal strength and travel time (which gives the distance to the target area). More sophisticated radar and sonar systems for large scale (swath) mapping project a narrow fan-shaped beam thereby illuminating a swath parallel to, and off to the side of, the instrument. This is called side-looking radar (SLR) or side-scan sonar (such as SeaMARC II, or HMR-1). The map is produced as the instrument travels along a line of flight (or shiptrack), sweeping its illuminated swath along the surface beneath it.
Synthetic Aperture Radar
Resolution in side-looking radar/sonar systems is limited by practical restrictions on the length of antennas. Synthetic aperture radar (SAR) overcomes this limitation by creating a synthetic "antenna" of (potentially) unlimited length, thereby narrowing the beamwidth and increasing resolution. SAR is the most commonly used system in radar imagery, but requires an extremely stable platform (in fact resolution is primarily limited by our ability to correct for motion of the instrument). There are sonar equivalents to synthetic aperture radar in the early stages of development. The problem is that the tracking stability required by synthetic aperture imaging systems is difficult to achieve in the ocean, particularly for the much longer time intervals necessary to record the returning signal.
 Figure 3. Models of surface roughness and return intensity for a smooth
surface (a) and a rough surface (b). Although depicted as originating at a
point in "a" and "b", the backscattered energy is averaged over the ground
resolution area. Return intensity as a function of incidence angle is shown in
c.
Figure 3. Models of surface roughness and return intensity for a smooth
surface (a) and a rough surface (b). Although depicted as originating at a
point in "a" and "b", the backscattered energy is averaged over the ground
resolution area. Return intensity as a function of incidence angle is shown in
c.
Summary
For most volcanic areas on earth, surface roughness is the predominant geologic factor influencing brightness of the backscatter image; the source wavelength and angle of incidence control the resulting radar/sonar signature. The biggest difference between the two systems is the 2x10⁵ difference in velocity and thus time necessary to receive the returning energy. Both are useful for studying/differentiating surfaces that are rough on the 1 to 200 cm scale.
reprinted from the Hawaii Center for Volcanology Newsletter, Volume 2, Number 1, December 1994
 Hawaii Center for Volcanology Home Page
This page created and maintained by
Ken Rubin ©,
krubin@soest.hawaii.edu
Other
Last page update on 31 Jan 2002