Greenhouse Gases - CO2, CH4, and N20
In this first section studying greenhouse gases, we will investigate carbon dioxide (CO2), methane (CH4), and nitrous oxide (N20). All these gases contribute to the natural background greenhouse effect. They are also being impacted by human activities which results in a human-induced greenhouse forcing. It is important to understand that the total greenhouse effect is a combination of natural and human-induced forcings.
Carbon Dioxide - CO2
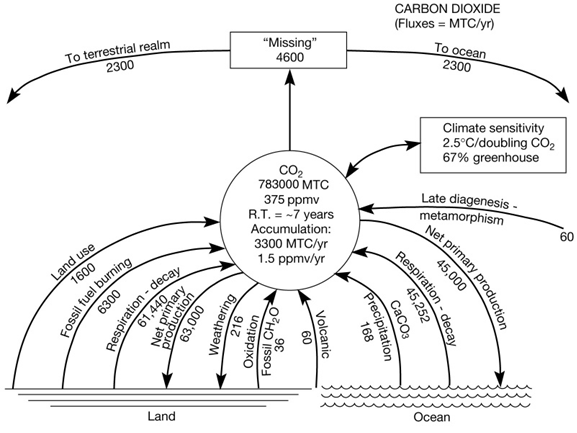
The natural carbon cycle involves the cycling of carbon through the reservoirs of the lithosphere, hydrosphere, atmosphere, and biosphere over a wide range of time and space scales. Some of the processes involved in carbon cycling have gone on throughout most of the history of the planet and variations in some of the fluxes in the cycle are responsible for changes in atmospheric carbon dioxide. Figure 6 shows the processes (for instance fossil fuel burning) and their rates or fluxes (in the case of fossil fuel burning = 6300 million metric tons of carbon per year) that involve the transfers of carbon at the Earth’s surface and alter the amount of carbon dioxide in the Earth's atmosphere.
Figure 6. Global biogeochemical cycle of carbon as carbon dioxide. Rates or fluxes (denoted by arrows) between land, ocean, and atmosphere reservoirs are in millions of metric tons of carbon (MTC) per year. The reservoir size of carbon dioxide is in millions of tons of carbon. The “Missing” is the amount of global CO2 emissions taken up by the ocean and terrestrial realms. The relative amount of “Missing” uptake by ocean and terrestrial realm, split evenly in this representation, is still debated although it appears now that the terrestrial realm is a slightly bigger sink for the excess CO2.
On short times scales – years to thousands of years – volcanoes, plants, animals, natural forest and grass fires, and decaying organic matter contribute carbon dioxide to the atmosphere. Photosynthesis takes carbon dioxide out of the atmosphere and stores it as carbon in the tissues of plants. Atmospheric carbon dioxide concentration has varied from about 200 parts per million by volume in recent glacial periods to 300 parts per million by volume during interglacial periods. So there is more carbon in the atmosphere during the warmer interglacial periods (300 parts per million) than during the cooler glacial period (200 parts per million). The warm Eemian-Sangamon interglacial period of 125,000 years ago had an atmospheric carbon dioxide content of 280 parts per million by volume while the Wisconsin ice age glaciation 18,000 years ago had an atmospheric carbon dioxide content of 180 parts per million by volume.
Fossil fuel burning is the major source of anthropogenic (this means human) produced carbon dioxide to the atmosphere. The world’s use and reliance on this energy source will impact the composition of the atmosphere far into the twenty-first century. Carbon dioxide is also released to the atmosphere by land use practices such as deforestation, which has been occurring for the past 10,000 years. During the 1990s, an estimated 1 to 2 billion tons of carbon per year were put in to the atmosphere from land use practices. The carbon system is currently difficult to balance in terms of inputs and outputs (see “Missing” in Figure 6). Of great importance is to determine where all the carbon is going that is emitted from human activities. Of the 7.9 billion tons of carbon per year emitted by human activities in the 1990s, 3.3 billion tons remained in the atmosphere leaving 4.6 billions tons per year unaccounted. Scientists have now determined that the oceans and land biomass each take up roughly half of the 4.6 billion tons.
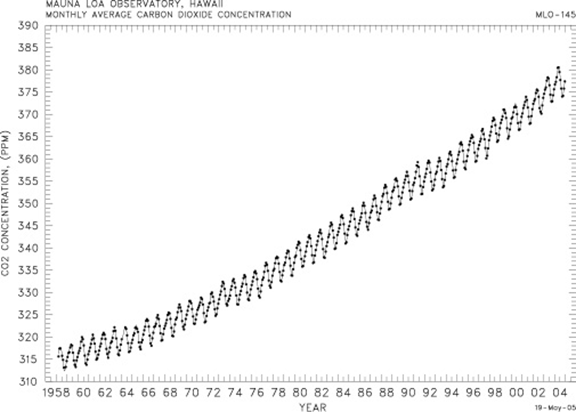
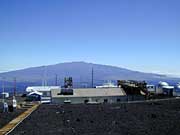
Charles Keeling of Scripps Institution of Oceanography in 1958 began a continuous sampling of atmospheric carbon dioxide at the Mauna Loa Observatory on the island of Hawaii (Figure 7). The trend in atmospheric carbon dioxide, supported by other like measurements at other locations around the world, demonstrates without question that in the past 50 years atmospheric carbon dioxide concentration has increased by more than 15%. Atmospheric carbon dioxide measurements (primarily from measurements of atmospheric gas composition taken from air bubbles trapped in ice cores many years ago and thus are a record of atmospheric carbon dioxide concentration at the time) demonstrate that atmospheric carbon dioxide levels have increased by 32% since pre-industrial time.
Figure 7. Mauna Loa CO2 curve. The y-axis is atmospheric CO2 concentration and the x-axis is the year. Note how the concentration increases from 1955 at 315 parts per million to 2005 at around 375 parts per million. Also note the yearly saw-toothed up-and-down pattern caused by the photosynthesis and respiration of the Northern Hemisphere land biosphere - primary plants and trees. In the summer, global atmospheric CO2 levels drop because of photosynthesis and uptake of CO2 by plants and trees to make material in the northern hemisphere. In the winter, the global CO2 levels rise because of respiration and decay of the plant and tree material by bacteria which converts plant and tree carbon into CO2 which goes back into the atmosphere. These data are collected at the Mauna Loa observatory.