

|
|
|
|
|
|
|
|
|
|
 |
|
|
|||||||
|
||||||||
|
||||||||
This page is part of a paper:
Pessi, A., S. Businger, K. L. Cummins, N. W. S. Demetriades, M. Murphy, and B. Pifer, 2009:
Development of a Long-Range Lightning Detection Network for the Pacific: Construction, Calibration, and Performance.
Journal of Atmospheric and Oceanic Technology, 26, 145-166.
Quantitative applications require assessment of the detection efficiency (DE) and location accuracy (LA) of the network, followed by construction of an accurate model of these effects. A calibrated model of DE and LA allows these important parameters to be estimated throughout the domain of the network. There are numerous factors that determine the DE of a Lightning Location System.
The form of the propagation model was shown to be a reasonable approximation of the observations from NLDN and a PacNet test sensor located in Arizona. To estimate DE for the LLDN, the two remaining parameters (peak current distribution and propagation characteristics; i.e., space constants) were needed for salt-water path conditions. These parameters were obtained by comparing recent information produced by the LLS operated by the Puerto Rico Electric Power Authority (PREPA) with information produced by the LLDN in the western Atlantic Ocean. The PREPA network is a short-baseline network comprised of five low-gain IMPACT sensors installed in 2003. Based on analyses performed by Vaisala, this network has a CG flash DE in excess of 95% over Puerto Rico and nearby surrounding waters, and a median location error of 500 m or less. The western Atlantic portion of the LLDN operates with the same location algorithm configuration as the PacNet network in the Pacific, but this region is too distant from the PacNet sensors to derive any value from them.
It has been shown (Orville and Huffines 2001) that the median peak current value for negative first strokes, inferred from LLS measurements, are somewhat larger when a stroke impacts salt water than when it strikes ground. It is unknown whether this enhancement is the result of a change in the relationship between peak field and peak current over salt water, or an actual increase in peak current in the channel. Either way, this effect produces a change in the population of source signals over salt water that needs to be accounted for when estimating LLS DE over the oceans.
To account for this salt-water effect, the peak current distribution was constructed using negative first strokes obtained from the PREPA LLS for the calendar year 2006 (Fig. 11), obtained from the "Sea" region surrounding Puerto Rico (Fig. 12c). A PREPA CG lightning stroke was considered to be detected by the LLDN if it occurred within 350 µs of the CG stroke detected by the PREPA network.
Since LLDN DE varies as a function of day and night, CG flash and stroke DE were computed as a function of peak current for both day and night. Daytime (night-time) statistics were only computed between the hours of 12 (00) and 22 (10) UTC, when the propagation path between Puerto Rico and the LLDN sensors was all daylight (night), with no terminator crossing between Puerto Rico and LLDN sensors. LLDN DE was defined as the percentage of PREPA CG flashes (or strokes) detected by the LLDN. The observed flash DE values were 4.7% for day and 20.8% for night.

Figure 11. Cumulative peak current distribution derived from CG
first strokes striking salt water near Puerto Rico.

Figure 12. Results from the detection efficiency model show (a)
5% day and (b) 20% night DE over Puerto Rico when using the
reference peak-current distribution and space constants of 2000 and
6000 km for day and night, respectively. (c) Insert: Lightning data
analysis region for Puerto Rico. The salt-water region is the "Sea"
region, with the exclusion of the "Land" region.
The attenuation rates in the DE model were adjusted (2000-km space constant during the day and a 6000-km space constant for night) so that the predicted DE (5% day and 21% night) was consistent with the observed DE (Fig. 12), given the observed salt-water peak current distribution in the vicinity of Puerto Rico (Fig. 11). Note that these space constants are smaller than those observed for the PacNet test sensor, which reflects that lesser performance of the NLDN sensors.
The refined DE model was then applied to the PacNet/LLDN sensor distribution in the central North Pacific, with the resulting predicted DE distribution shown in Fig. 13. In applying the refined DE model to Hawaii, it is assumed that the weather regime in the two locations, in a prevailing trade-wind belt, will produce similar peak current distributions. In this regard, it should be noted that during the period of the Puerto Rico data analyzed, no tropical cyclones passed through the region studied. Later, comparison between observed and predicted DE in the vicinity of Hawaii will be presented to test the validity of this assumption.
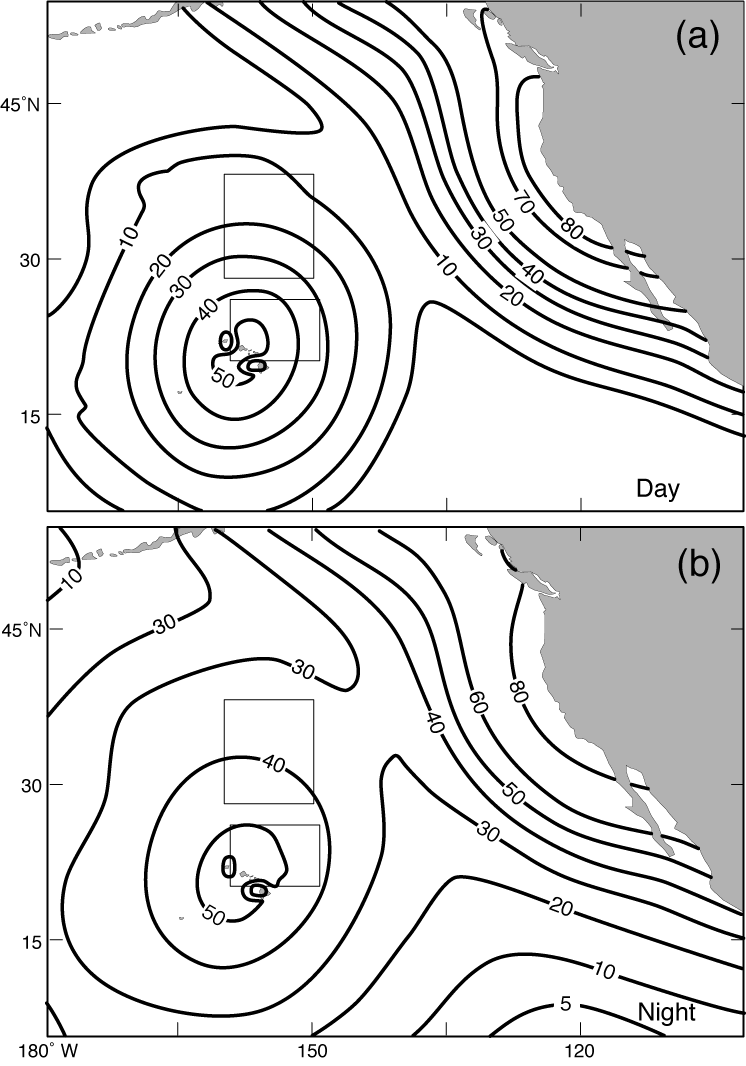
Figure 13. Modeled DE (%) over the Pacific during (a) day, and
(b) night. The boxes show the areas where the observed DE was
assessed. The observed values for the Hawaii region were 22% and
61% during the day and night, respectively. DE values for the
central-north region were 19% and 44% for day and night,
respectively.
As described by Cummins et al. (1998b, Appendix) the median estimated location accuracy is defined as the semi-major axis of a location error ellipse. For the PacNet/LLDN LA model, the ellipse is computed for each element of a 75X75 point grid, and is determined by sensor locations, probability of detection by specific groups of sensors (DE model), and the time and angle standard errors. The timing and angle error characteristics were derived empirically using the PacNet test-sensor data. The errors were parameterized as the standard deviation of a normally distributed random variable (Figs. 7 and 8), resulting in a 5-µs RMS timing error value and an angle error of 4.5 degrees RMS employed in the LA model.
The resulting modeled LA values are mostly between ~2 and 16 km between Hawaii and North America (Fig. 14). In the vicinity of Hawaii, the two Hawaiian sensors dominate the location accuracy in this DE-weighted LA model, because the detection efficiency of the other sensors outside of Hawaii is much lower over this area. Although the distant sensors contribute slightly in the vicinity of Hawaii, the two Hawaii sensors detect the majority of the events. This two-sensor "sub-network" exhibits the poorest LA near the exterior of the baseline defined by the two sensors (to the northwest and southeast), and the best LA when lines extending from the two sensors intersect at a 90-degree angle at the location of the lightning strike. In the immediate vicinity of Hawaii (northeast and southwest) the LA is relatively good, but deteriorates away from the islands, as the detection angle becomes unfavorable. Farther to the northeast of Hawaii the sensors from NALDN begin to detect flashes and the LA improves. The Kwajalein sensor improves the LA slightly to the southwest of Hawaii. Areas of the poorest LA occur to the southeast of Hawaii, near the extension of the baseline between the two Hawaii sensors. Furthermore, there are no additional sensors in that direction, nor does the area get any contribution from the other sensors, due to both the lower gain of the NALDN sensors and the applied hard limit of the detection distance in the LA model (5000 km). To the northwest of Hawaii, Unalaska and Kwajalein improve the LA slightly, but the Hawaii sensors still dominate in the LA performance.
It should be noted that the LA and DE have improved recently, specifically over the western parts of the domain, because of the added sensors in the West Pacific.
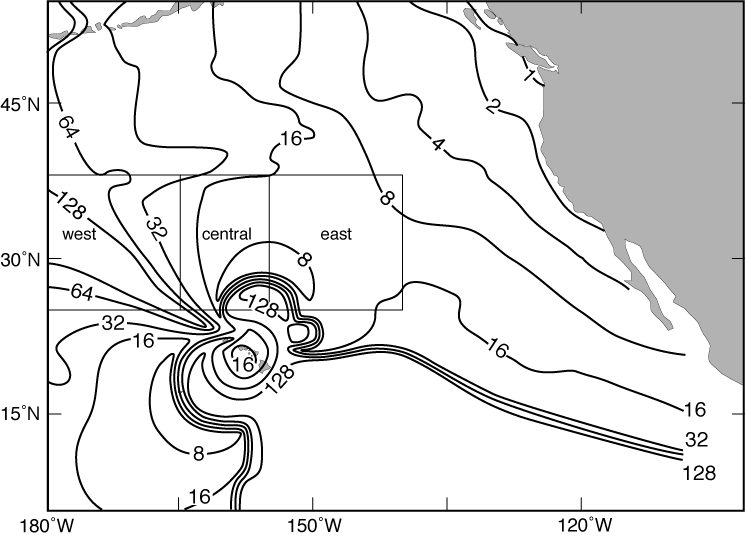
Figure 14. Modeled LA (km) of PacNet/LLDN with four PacNet
sensors located in Unalaska, Kwajalein, Lihue, and Kona (+ LLDN).
The boxes show the areas where the observed LA was
assessed.
The performance of PacNet/LLDN was assessed using data from NASA's Lightning Imaging Sensor (LIS) onboard the Tropical Rainfall Measuring Mission (TRMM) satellite. Both DE and LA were evaluated using time-correlated LIS flashes with PacNet/LLDN data. Three years of PacNet/LLDN data were used to assess the performance (DE and LA) of PacNet/LLDN over the central Pacific (February 2004 - February 2007). Only days when at least three PacNet sensors (Unalaska, Lihue, Kona + LLDN) were up were included in the analysis. In addition, PacNet/LLDN data were filtered by removing multiple events.
The DE over the central Pacific was tested over two areas: near Hawaii (20-26N; 149-159W) and over the central-north region (28-38N; 150-160W) (Fig. 13). The total number of LIS and PacNet/LLDN flashes occurring over the grid cells were counted over the three-year period, February 2004 - February 2007. Both day and night DE were assessed. Day (night) data include all the flashes occurring between 9-15 (21-03) local time (LT) over each grid cell. The six-hour time windows centered at midnight and noon were selected to avoid terminator effects in the propagation path. Three different corrections were applied to LIS data to make the PacNet/LLDN and LIS flash rates comparable. (i) LIS data were DE-corrected using values of 0.73 for day and 0.93 for night, according to Boccippio et al. (2002), (ii) LIS view time is a function of latitude, thus the flash rates were normalized for view time over the selected areas, and (iii) LIS reports were corrected for an estimated IC:CG ratio, since LIS detects both intracloud (IC) and cloud-to-ground (CG) flashes, whereas the strikes detected by PacNet/LLDN are predominantly CG.
Since no high-quality lightning data are available over the central North Pacific, data from the Puerto Rico Electric Power Authority (PREPA) LLS, described in section 4, were used to estimate the IC:CG ratio. Although Puerto Rico is in a different basin than PacNet, PREPA provided suitable high-quality lightning data for determining the IC:CG ratio over the subtropical ocean. This analysis yielded an oceanic IC:CG ratio of 4.8, which was used to normalize the LIS flash rates for the PacNet/LLDN DE estimation over the Hawaii region. Previous studies have shown a weak correlation between IC:CG ratio and latitude, with IC:CG decreasing with increasing latitude (Pierce 1970; Prentice and Mackerras 1977; Mackerras et al. 1998;). Therefore, we used a IC:CG ratio of 4.0 over the central-north region (28-38N) to normalize the LIS flash rates. This value is consistent with the aforementioned studies.
Using the above approach, DE over the Hawaii region was calculated to be 22% during the day and 61% at night. DE over the central-north region varied between 19% during the day and 44% at night (Fig. 13)
It is suggested that the underestimate of the daytime DE is because of partial blockage of groundwaves by high terrain to the north and east of the Kona sensor. Slightly higher DE at night may simply be a reflection of the longer space constants that characterize the performance of the PacNet sensors in Hawaii.
Location accuracy (LA) is defined as the difference between the actual flash location and the location the LLS observes. The location accuracy of PacNet/LLDN was assessed using LIS data. LIS flash location is an optical centroid with nadir and limb resolutions of 4 and 6 km, respectively. Therefore, the results from the LA analysis need to be interpreted cautiously, considering the resolution of LIS data. The great-circle distances between all the PacNet/LLDN and LIS flashes occurring within ±1 ms time window were computed. The time stamp in the LIS flash data is not corrected for transmitting delay, resulting in 2 ms bias in the dataset (D. Boccippio 2007, personal communication). Therefore, PacNet/LLDN events were temporally matched with LIS flashes that occurred within a 1-3 ms lagged time window of LIS time stamp. The SMA and chi-values represent the quality of the location, and if there are multiple locations within 1 ms, the flash with the smallest value of SMA/sqrt(chi) is chosen to represent the flash location. As the number of matching pairs was relatively small, LA was averaged over relatively large grid boxes to obtain a reasonable sample size. All the boxes were located between 25-38N, with "east", "central", and "west" box boundaries of 140-155W, 155-165W, and 165-180W, respectively. The median observed location accuracies over the east, central, and west boxes were 13, 35, and 40 km, respectively (see Fig. 14). Although the data points are relatively evenly distributed over the boxes, the modeled LA does vary within each box, especially within the west box. Therefore, the median modeled LA over each box was computed by taking the median of the modeled LA at each of the locations of the lightning strikes inside each box. The LA model has 1.2 degree latitude x 2.0 degree longitude grid spacing. The median modeled location accuracies over the east, central, and west boxes were 12, 11, and 67 km, respectively.
Calibration of PacNet/LLDN includes the calculation of site error corrections. Site errors are systematic angle errors caused by scattering of the received signals in the vicinity of the sensors (e.g., Krider et al. 1976; Hiscox et al. 1984). The calibration process relies on redundant information in the form of additional lightning sensors or an independent measurement source. Given that (at the time the analysis) there were four PacNet sensors in the North Pacific and only two sensors in Hawaii (Lihue and Kona), existing site error corrections are challenging. Therefore, in the vicinity of Hawaii, lightning strikes near the baseline between the two Hawaii sensors may have large location errors when only these two sensors detect the discharge. By contrast, strikes away from the baseline can be accurately located, especially if additional sensors outside Hawaii participate in the detection. Strikes detected with more than two sensors are less sensitive to site errors due to the nature of the combined direction-finding and time-of-arrival methods (Cummins et al. 1998b). In practice, the favorable geometry afforded by the large number of U.S. and Canadian sensors helps to reduce the location errors over the eastern Pacific near the coast of North America.
Acknowledgments: We are grateful to James Weinman for his encouragement to undertake the development of PacNet, to Joseph Nowak for help with detector site selection and installation, and to Nancy Hulbirt for assistance with graphics. This work is supported by the Office of Naval Research under grant numbers N00014-08-1-0450 and N00014-05-1-0551.