

|
|
|
|
|
|
|
|
|
|
 |
|
|
|||||||
|
||||||||
|
||||||||
This page is part of a paper:

Pessi, A. and S. Businger, 2009: The Impact of Lightning Data Assimilation on a Winter Storm Simulation over the North Pacific Ocean.
Monthly Weather Review,  137, 3177-3195.
A method is described for assimilation of calibrated, long-range lightning data into the MM5 mesoscale numerical model. The method utilizes an empirical lightning-convective rainfall relationship, derived specifically from North Pacific winter storms. The assimilation method nudges the model's latent heating rates according to rainfall estimates derived from PacNet/LLDN lightning observations. To illustrate the potential of the method, lightning data associated with a notable storm of December 2002 were assimilated into a mesoscale NWP model. The application of lightning data assimilation reduced the central pressure forecast error from 10 to ~2 hPa. Sensitivity tests showed that the latent-heating assimilation method is relatively insensitive to errors in the assimilated lightning rates.
Eastward propagating extratropical storms over the North Pacific Ocean can bring hazardous weather conditions to the west coast of North America. These storms are often poorly forecast because the lack of observations over the Pacific Ocean results in incompletely described initial conditions in NWP models. In turn, inadequate initial conditions along the west coast can lead to error propagation in model runs downstream over the mainland U.S. A notable example was a poorly forecast extratropical cyclone that deepended rapidly as it approached the west coast in December 2002 (Fig.1). The NCEP Global Forecast System produced a 10-hPa error in the 12-hour central pressure forecast for this storm. An interesting charateristic of this system was a band of active thunderstorms along the storm's cold front.
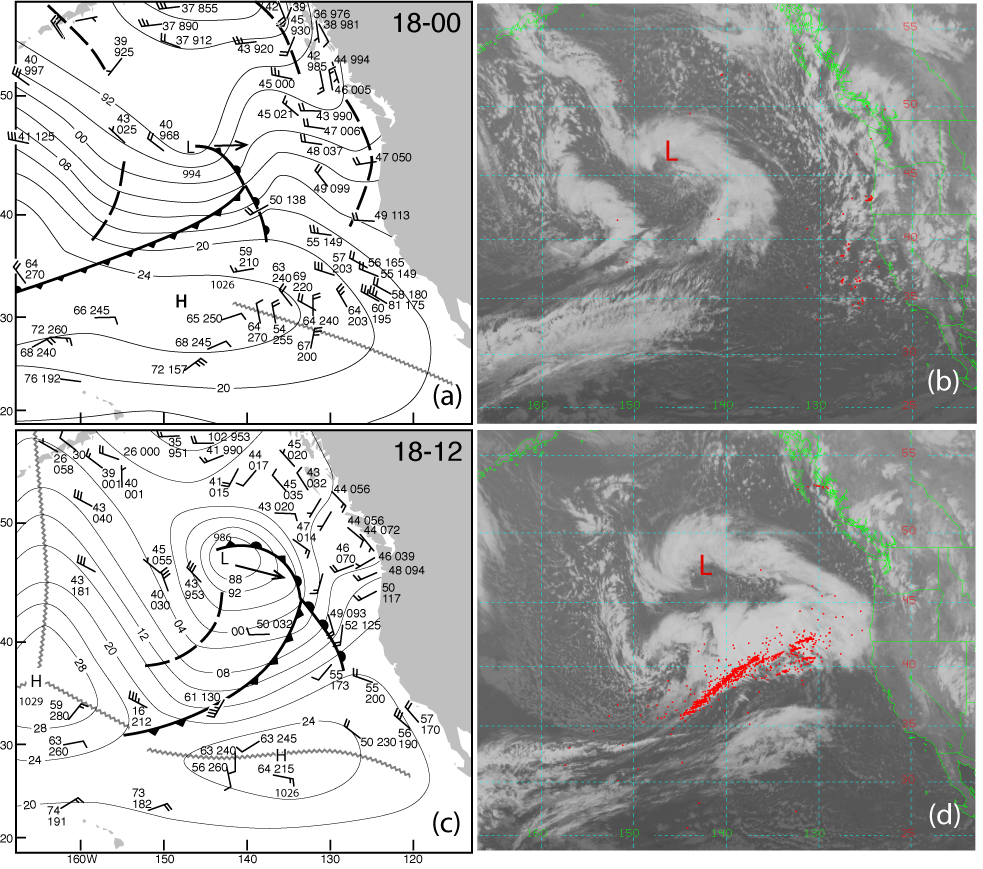
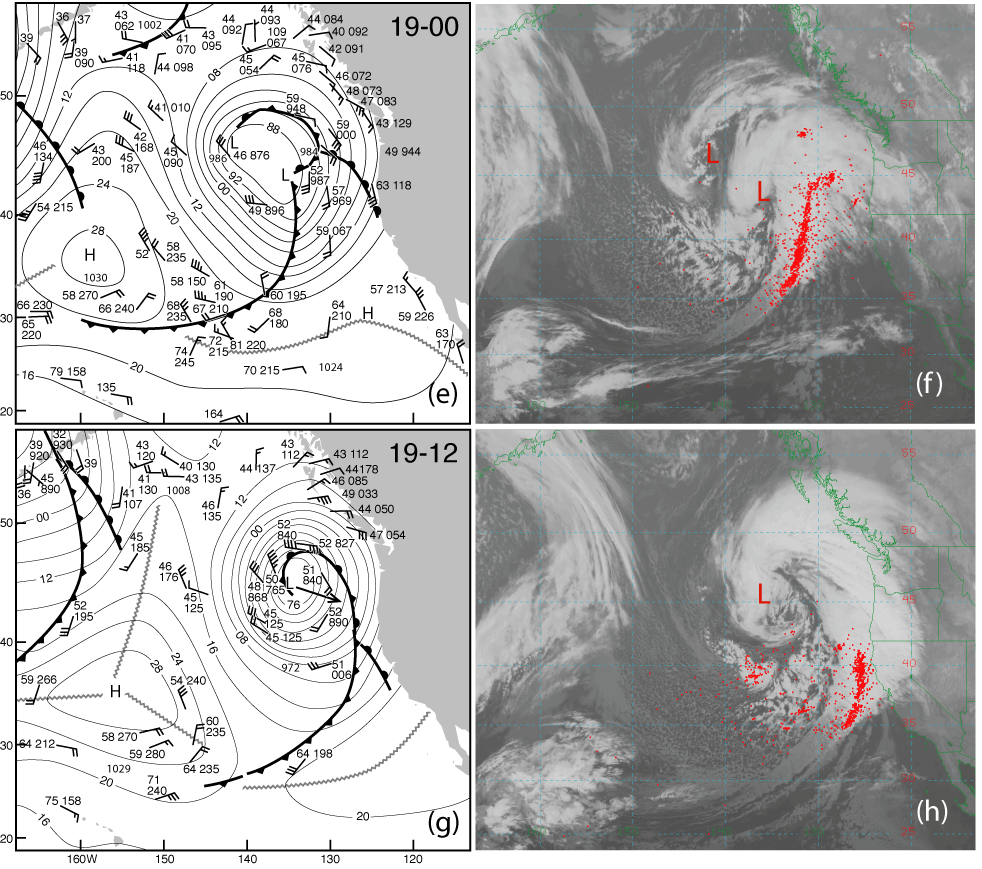
Figure 1. (a) Surface analysis of the eastern North Pacific Ocean valid at 0000 UTC on 18
December 2002. (b) GOES-10 IR satellite image valid at 0030 UTC on 18 December 2002
overlaid with one hour of lightning observations. Each red dot indicates a lightning flash
detected by LLDN ± 30 minutes from the satellite image time. Red "L" marks the low center.
(c) Surface analysis valid at 1200 UTC and (d) satellite image valid at 1230 UTC 18
December 2002. (e) Surface analysis valid at 0000 UTC and (f) satellite image valid at 0030
UTC 19 December 2002. (g) Surface analysis valid at 1200 UTC and (h) satellite image valid at
1130 UTC 19 December 2002.
The model used in this study is the Fifth-Generation National Center for Atmospheric Research (NCAR) - Penn State Mesoscale Model (MM5). The horizontal resolution of the model is 27 km and it has 39 vertical levels. The model is non- hydrostatic and the time step used was 81 s.
The latent heating lightning data assimilation (LHA) method was implemented in the Kain-Fritsch (KF) convective parameterization scheme by modifying the model-generated vertical latent heating profiles. The method scales the model's vertical latent heating profiles at each grid point and model level depending on the ratio of rainfall predicted by the model to rainfall derived from lightning data (Fig.2). The scheme was successfully used by Manobianco et al. (1994) to assimilate satellite-derived rainfall rates into a mesoscale model during a rapidly intensifying extratropical cyclone. A similar type of scheme has been later used by Karyampudi et al. (1998), Alexander et al. (1999) and Chang et al. (2001) to assimilate rainfall rates derived either from satellite or/and lightning data.
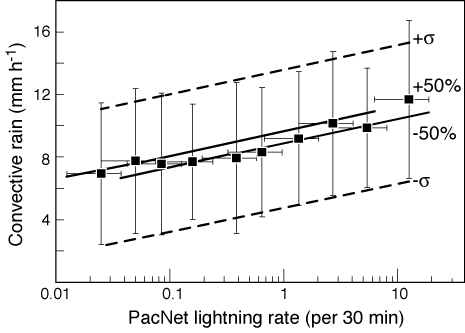
Figure 2. Lightning-convective rainfall relationship using PacNet lightning data and TRMM's
PR rainfall data. The solid squares (no fitted curve shown) are described by the equation
y=0.67ln(x)+9.2 (R2=0.89). The y-error bars represent ±1 stdev in rainfall rates. The
corresponding fitted curves (dashed) are described by equations y=0.68ln(x)+13.6 (R2=0.75) and
y=0.66ln(x)+4.8 (R2=0.92), respectively. The x-error bars and corresponding curves
illustrate a hypothetical ±50% error in lightning rates. The upper and lower curves are
described by equations y=0.67ln(x)+9.6 and y=0.67ln(x)+8.9, respectively.
An oceanic storm case was analyzed using the available PacNet data. An extratropical cyclone moved across the northeast Pacific Ocean and approached the west coast of the United States 18-20 December 2002. The storm was poorly forecast initially and very lightning-active, making it feasible for a case study.
The storm deepened rapidly - from 984 to 972 hPa - between 0000 and 1200 UTC on 19 December 2002. A twelve-hour MM5 control forecast initialized at 0000 UTC and valid at 1200 UTC on 19 December 2002 showed 982 hPa storm central pressure (Fig. 3a) , whereas the observed value was 10 hPa lower (Fig. 1g). The National Centers for Environmental Prediction (NCEP) Global Forecast System (GFS/AVN) and Eta models showed similar errors. The GFS (Eta) model's 12-hour forecast was 10(9) hPa too high; when lightning data were assimilated into MM5, the 12-hour central pressure forecast error reduced to 2 hPa (Fig. 3b) . Three hours later (15-hour forecast), the MM5 central pressure forecast with LHA reached 972 hPa - the same value as was observed at 1200 UTC. The difference between the lightning data assimilation and control runs is shown in Fig. 4 .
The impact of LHA on a longer simulation was investigated by starting the model run 12 hours earlier, at 1200 UTC on 18 December 2002 and similarly assimilating lightning data during the first eight hours of the model run. The results were very similar: the lightning data assimilation reduced the central pressure error to 2 hPa (970 hPa).
Figure 3. Twelve-hour MM5 forecast of sea-level pressure (hPa) and 3-h accumulated rainfall
(mm) valid at 1200 UTC on 19 December 2002. (a) Control run and (b) LHA run.
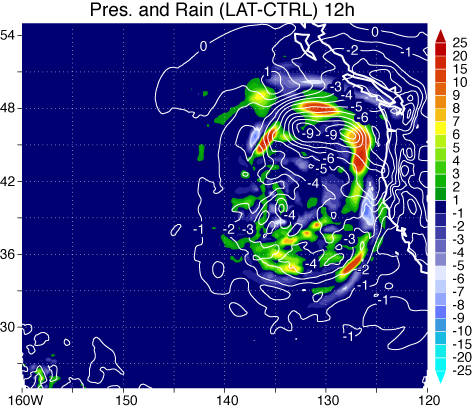
Figure 4. Difference in sea-level pressure (hPa) and rainfall (mm) between the LHA and control
runs (as shown in Fig. 3). Valid at 1200 UTC on 19 December 2002. "LAT" in figure titles
indicates latent heating LHA run and "CTRL" indicates control forecast.
If the majority of the lightning was observed over a narrow cold front hundreds of kilometers (~300-1200 km) away from the storm center, what caused the storm central pressure to drop? Figures 5 a-d show the evolution of a 700 hPa equivalent potential temperature field between 0000 and 1200 UTC 19 December. Although the equivalent potential temperature is conserved in a reversible moist adiabatic process (and thus latent heating itself does not change it), convective temperature and moisture are adjusted in the assimilation method, resulting in altered theta-e. Equivalent potential temperature was chosen to illustrate the evolution of warmer and moister air mass resulting from the lightning data assimilation.
The conclusion of this analysis is that the assimilation method adjusted the mass (and to some extent the moisture) field in the lightning-active areas. The model responded to the altered mass field by geostrophically adjusting the pressure and wind fields. The assimilation increased the temperature gradient across the front, with thermal wind balance ensuring an increase in the along-front winds. This enhanced the advection of warm air over the storm center and dropped the surface pressure hydrostatically (Fig. 6).

Figure 5. Difference in 700 hPa theta-e between the control and LHA runs at (a) 0300 UTC, (b) 0600
UTC, (c) 0900 UTC, and (d) 1200 UTC on 19 December 2002 (shaded, [K]). Sea-level pressure
is shown from the LHA run at given hour (contours, [hPa]).
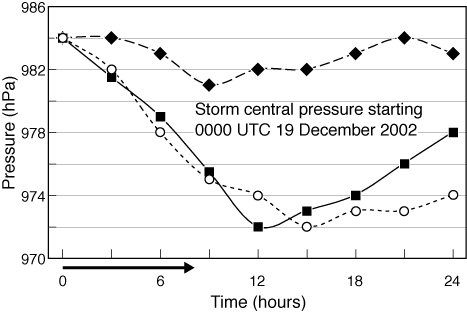
Figure 6. Comparison of observed storm central pressure (solid) with that predicted by MM5 with
(dotted) and without (dashed) lightning data. The model was initialized at 0000 UTC 19
December 2002 and run for 24 hours. The observed values are from the NWS North Pacific
surface analyses at 0000, 0600, 1200, and 1800 UTC, and the values between them are linearly
interpolated. The arrow shows the LHA period.
Errors in lightning and rainfall measurements impact the latent heating rates that are assimilated into the model. Errors in lightning measurements have a direct effect on the rainfall- and latent heating rates that are assimilated (Fig. 2, x-error bars). On the other hand, standard deviation in convective rainfall rates is quite large (Fig. 2, y-error bars) and it is important to know the impact of these uncertainties on modeling results. Errors in quantified lightning rates may result from uncertainties in the DE-model, terminator effects, and power- or network outages that disable a sensor location. The sensitivity of the model simulations to rainfall rates was investigated by using the upper and lower boundaries for convective rainfall rate shown in Figure 2. These curves correspond to ± one standard deviation in rainfall rates. The results from these two runs (hereafter referred as "+stdev" and "-stdev") were compared to the "standard" LHA model run using the middle curve in Figure 2.
Figure 7 shows that the difference in central pressure during the 36-hour forecast period remains below 2 hPa in all three LHA runs. The analysis shows that the model is relatively insensitive to errors in the lightning- rainfall relationship . This result likely reflects the fact that even a ± 50% variations in lightning rates result in small variations in the rainfall and assimilated latent heating rates because of the logarithmic nature lightning-rainfall relationship (Fig. 2). Moreover, triggering convection in the grid points where the model is originally dry is more significant than small errors in estimation of latent heat. These results are encouraging for lightning data assimilation, as they relax the requirements for accuracy in quantifying lightning rates (DE-model) and in deriving the lightning-rainfall relationship.
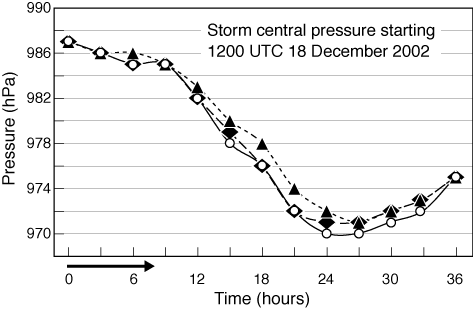
Figure 7. Comparison of "standard" LHA run storm central pressure (solid) with pressure
from LHA run using +1 stdev rainfall rates (dashed) and -1 stdev rainfall rates (dotted). The model
was initialized at 1200 UTC 19 December 2002 and run for 36 hours.
Acknowledgments: We would like to thank Tiziana Cherubini for her assistance in the modeling experiments. We are grateful to Ken Cummins and Nick Demetriades for their support in the development of PacNet and for providing PacNet data, to Joseph Nowak for help with detector site selection and installation, and to Nancy Hulbirt for assistance with graphics. This work is supported by the Office of Naval Research under grant number N000140510551.