


Infographics workshop helps UH Mānoa students improve science communication skills
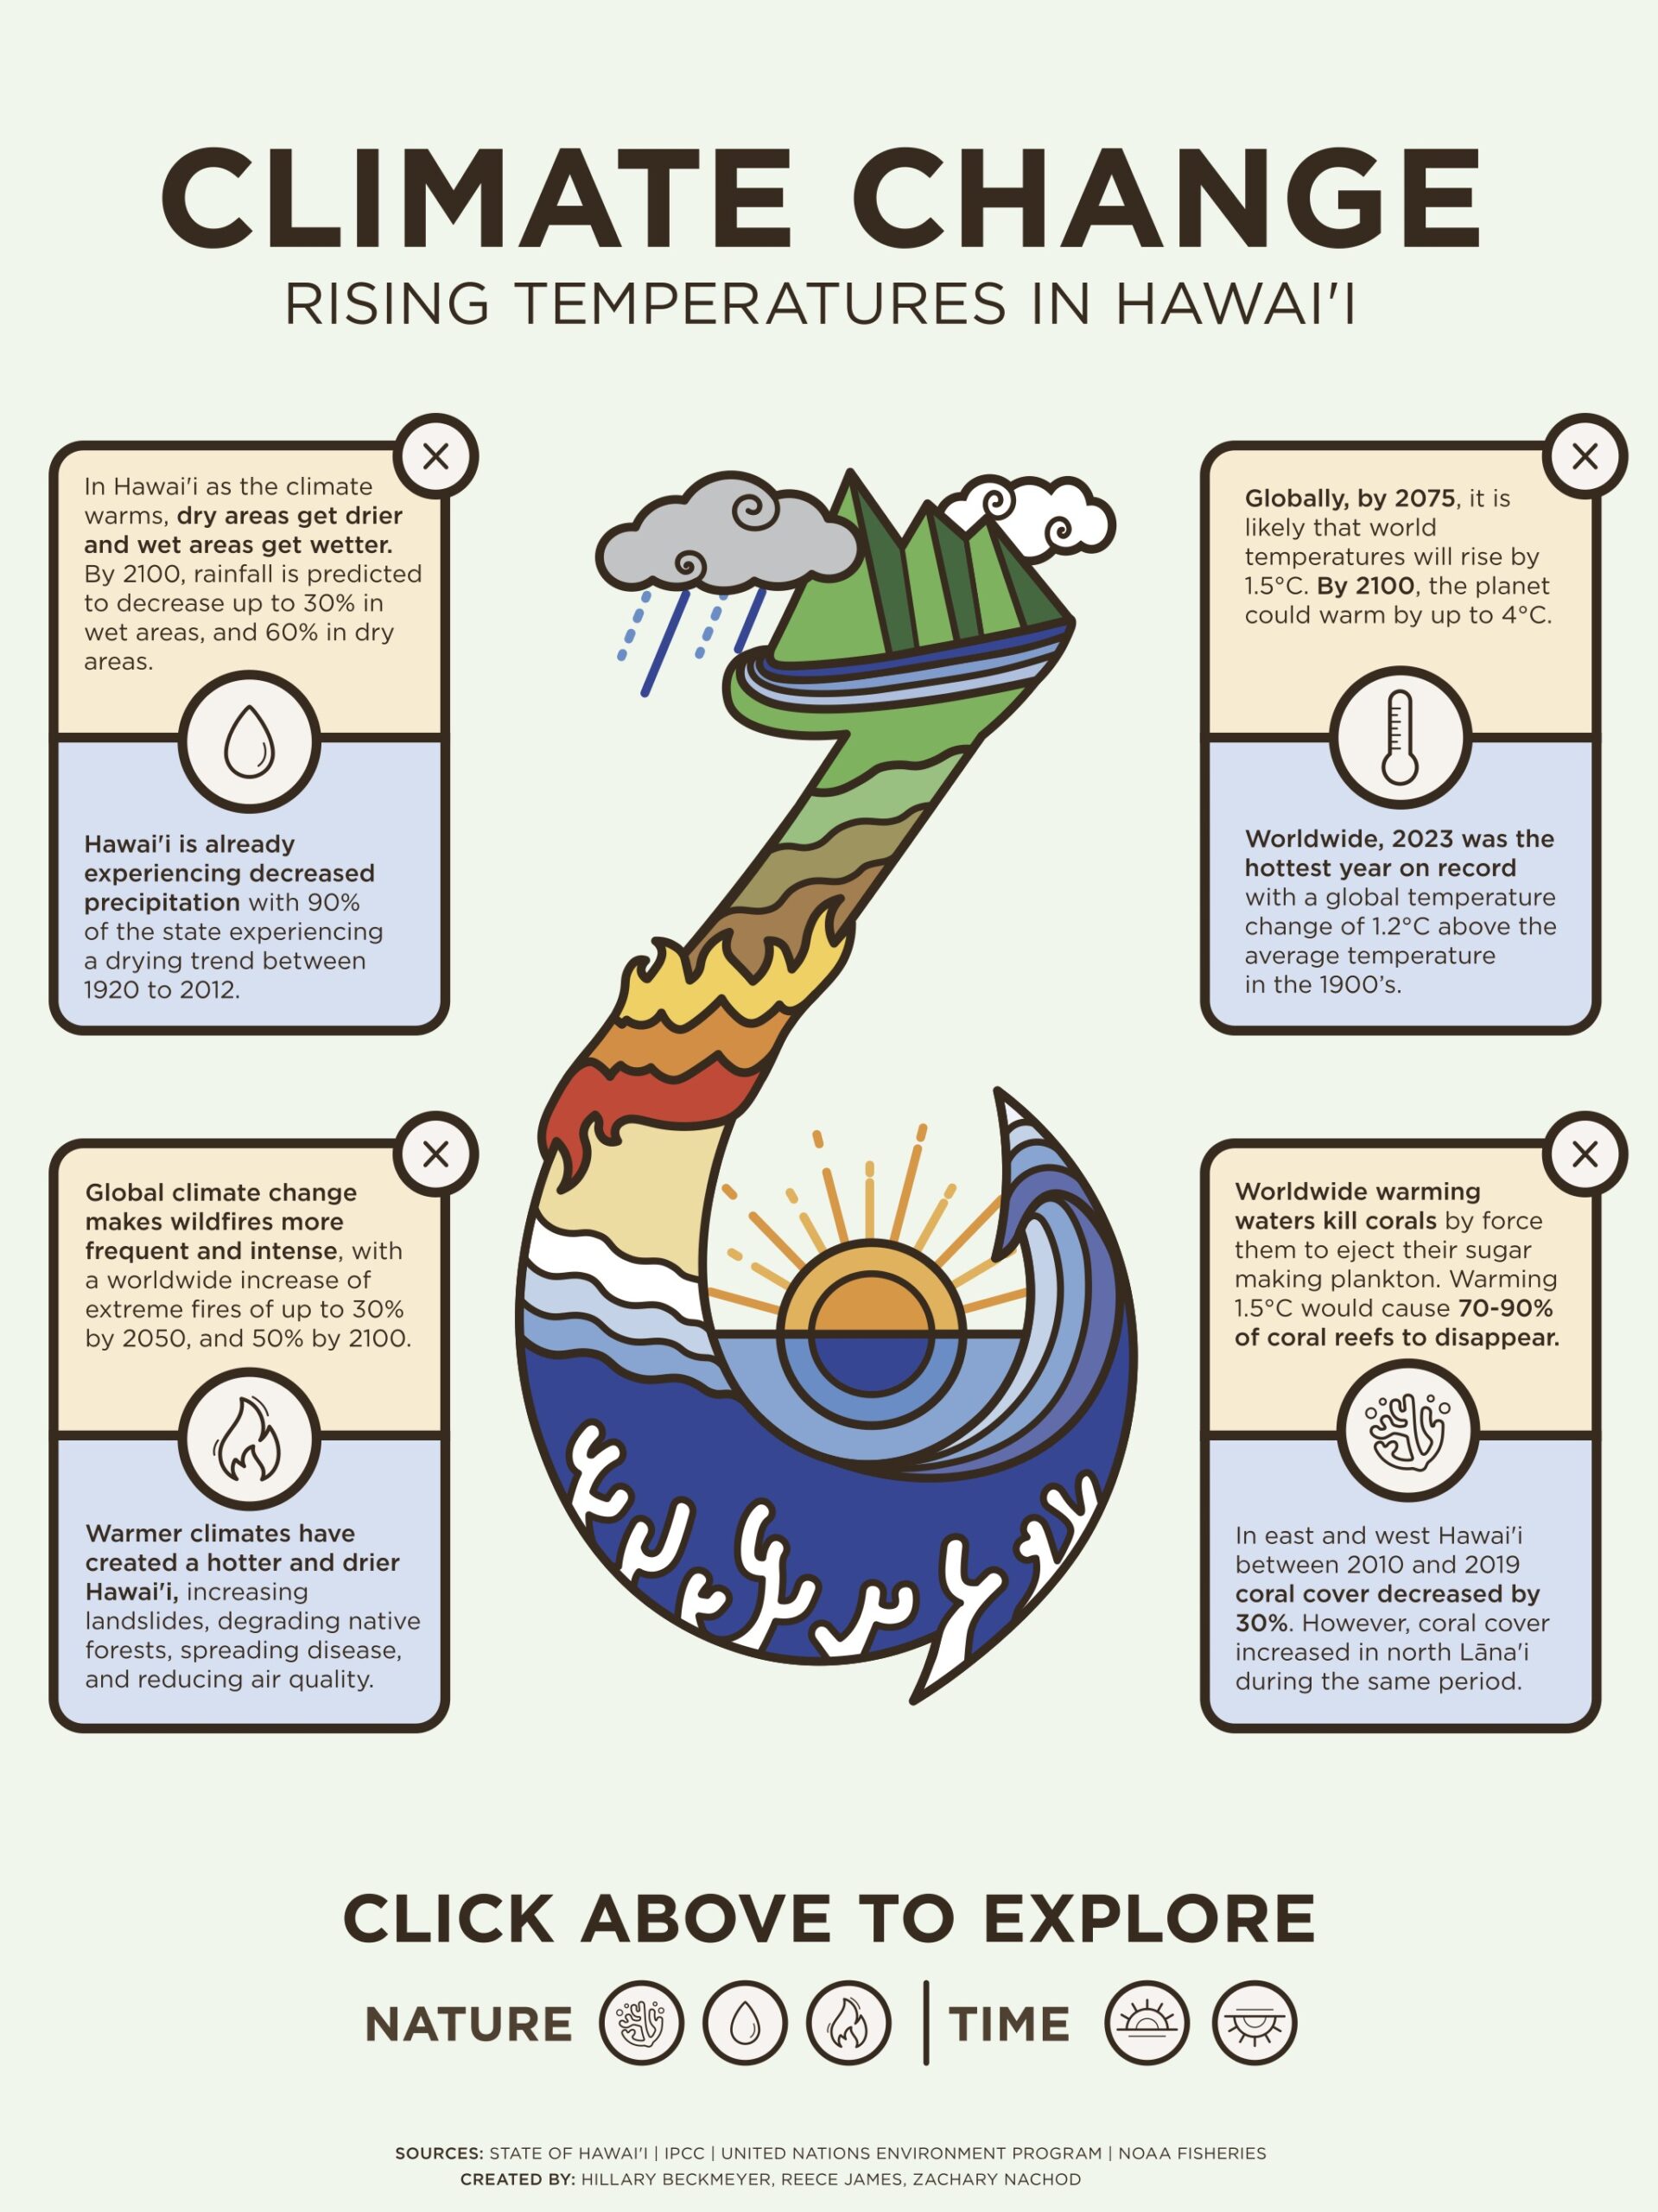 Infographic of climate change impacts in Hawai'i. Credit: Hillary Beckmeyer, Reece James, Zachary Nachod
Students at the University of Hawai‘i at Mānoa enhanced their science communication skills through a new infographics workshop funded by the National Science Foundation. The five-day workshop, hosted by the UH Mānoa School of Ocean and Earth Science and Technology (SOEST), brought together a group of students from the fields of climate and ocean science.
Led by instructors Malte Stuecker, assistant professor in the Department of Oceanography in SOEST, and Esther Gonstalla, an award-winning freelance infographics designer and published author, the workshop seeks to bridge the gap between complex scientific concepts and public understanding.
“Effective science communication is vital in addressing pressing global challenges such as climate change,” said Stuecker. “Through this workshop, we aim to equip students with the skills to convey scientific findings in a clear, engaging, and compelling visual language.”
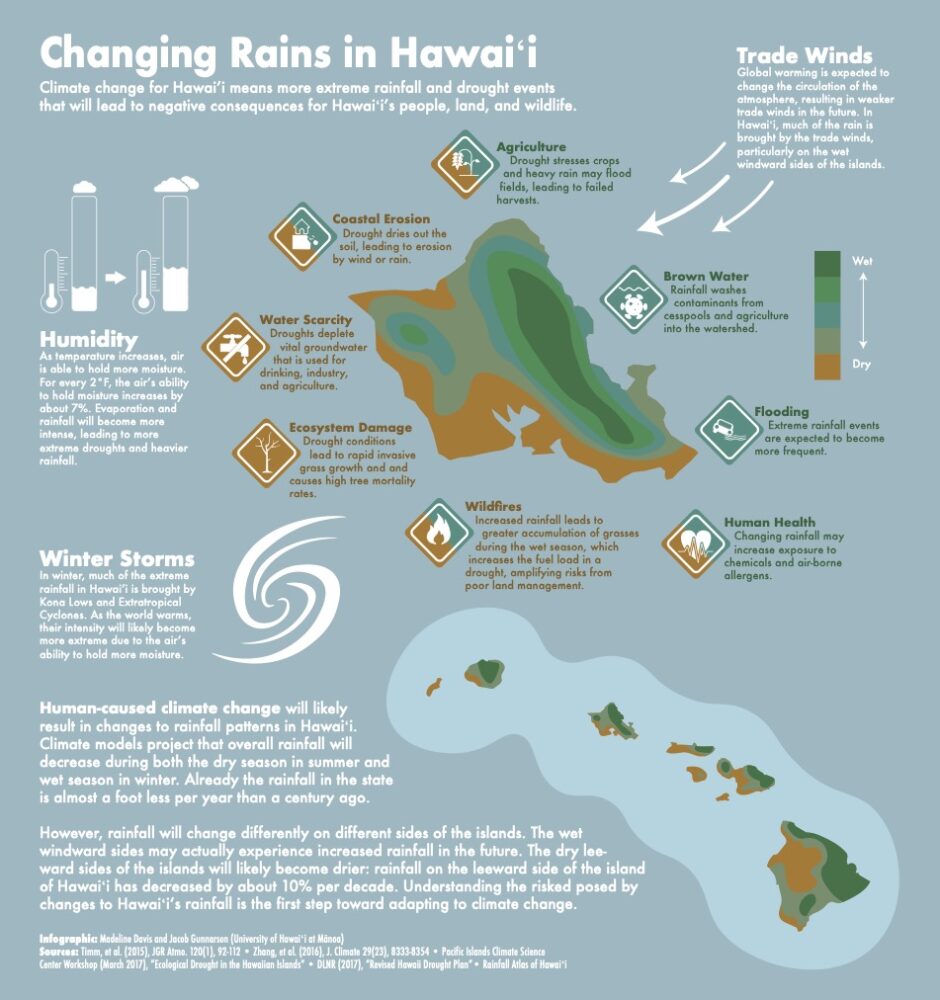
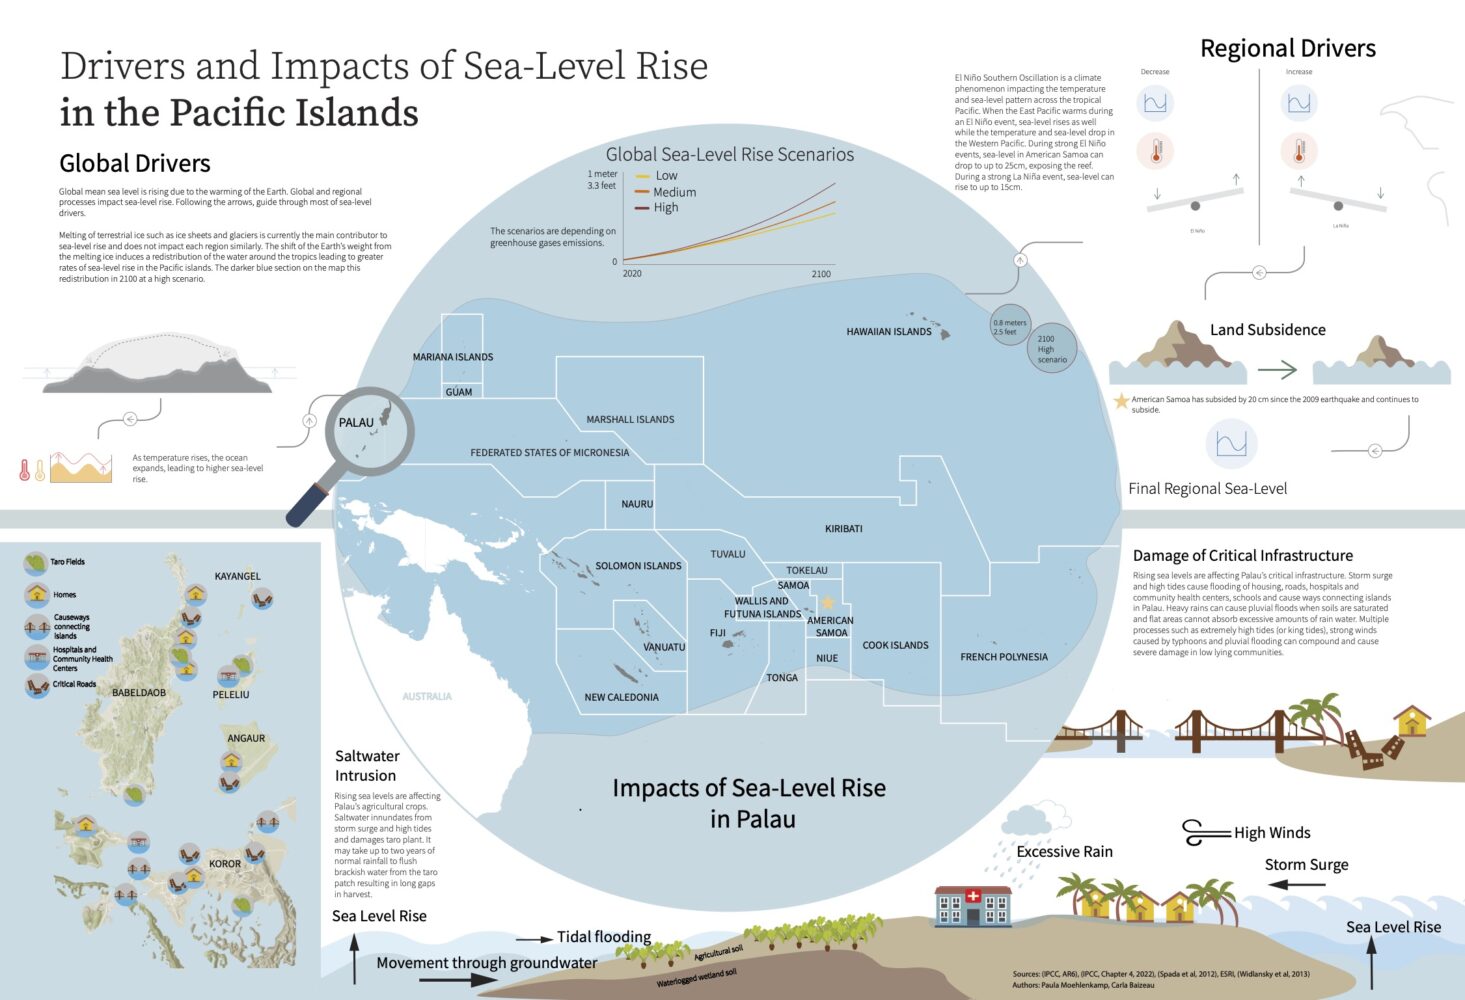
Over five days, participants learned the principles of infographic design and communication strategies, as well as exploring techniques to distill complex data and research findings into visually appealing graphics. Through hands-on exercises, group discussions, and expert guidance, students learned how to create impactful infographics that resonate with the general public. During the workshop three infographics were created by the students, which focused on different climate impacts of importance for Pacific islands: changes of sea level, temperatures, and rainfall patterns.
Esther Gonstalla emphasizes the importance of visual storytelling in engaging the public.
“Infographics are a great tool to make complex scientific information easily accessible to everyone,” said Gonstalla. “It is important in times of climate change that the scientific findings reach a broad audience. I’m excited to collaborate with science students. The new visualization tools learned in this workshop can significantly enlarge the audience of their future research papers by incorporating their own easy-to-read infographics.”
The workshop took place from March 18-22, 2024 on the University of Hawai‘i at Mānoa campus.