Sun Photometer and Lidar Measurements of the Plume
from the
John N. Porter, Keith A. Horton, Peter J. Mouginis-Mark, Barry Lienert,
Hawaii Institute of Geophysics and Planetology,
A. Jeff Sutton and Tamar Elias
Clive Oppenheimer
Department of Geography,
Abstract.
Aerosol optical depths and lidar measurements were obtained under the plume of
Hawaii Kilauea Volcano on
1. Introduction
Measurements of volcanic plume sulfur gas
and aerosol emission rates can be based on either in situ [Hobbs et al., 1982; Stith et
al., 1987; McGee and Gerlach, 1998] or remote sensing
techniques [Andres et al., 1989; Realmuto et al.,
1997]. A widely accepted technique to
measure SO2 column abundance is
by correlation spectrometer (COSPEC), which
employs spectral absorption features of SO2
gas [Rose et al., 1986; Sutton et al., 2001]. Lidars have also been used to
image plume shape [Casadevall
et al., 1984; Hobbs et al., 1991]. Sun photometer measurements have also been used to derive volcano aerosol size
information [Watson and Oppenheimer, 2000; 2001]. Here we combine three remote
sensing techniques, aerosol sun photometry, lidar, and COSPEC measurements to
estimate the total oxidized sulfur emissions from the Pu‘u O’o plume and the SO2
lifetime.
2. Sun
Photometer and Lidar Aerosol Measurements
On

Figure 1. Landsat 7 satellite image collected on January 7, 2001 (at
approximately 10:30 am local time) combined with a digital elevation map
showing the location of the Chain of Craters road and the Pu’u
O’o vent. Vertical stems show the aerosol optical
depths (at 500 nm) measured at each point along the road on
Figure 1 shows the average aerosol optical
depth (at 500 nm) measured at each location along the Chain of Craters road
during the third pass. Figure 1 also shows the location of the plume on January
7, 2001, when the Landsat 7 image was taken.

Figure 2. Aerosol size distributions inverted
from the aerosol optical depths measurements.
Figure 2 shows a range of lognormal
aerosol size distributions, which have spectral scattering coefficients (from
Mie theory) that fit the measured aerosol optical depths within their
uncertainty. Although a more elegant approach is certainly possible [Lienert et
al., 2001], here we have simply tested a range of different size distributions
with geometric mean diameters (0.02-0.55 mm) and standard deviations (1.45-3.0) which extend well past those
that best fit the data. A real index of
refraction of 1.35 with no absorption was assumed here. The uncertainty in the
aerosol optical depth measurements and the limited range of wavelengths
prevents us from further defining the size distribution.

Figure 3. Aerosol scattering coefficient (at 500
nm) derived from the lidar while passing under the plume during the third
pass. The log of the aerosol scattering
coefficient is shown on the right. The data are shown at the height from the
surface
During each pass, lidar measurements were
obtained (zenith angle of ≈38 º) through the vehicle open door (see Fig.
3). The custom lidar system used for
this experiment was a co-axial 12.7 cm telescope system using a 15 mJ pulsed frequency doubled (532 nm )
Nd-YAG laser with 20 Hz pulse rate. A photomultiplier
tube detector equipped with a custom log-amp yielded signal from 90-m out to
3-km. In order to avoid damage to the
detector from bright sunlight, we always pointed the lidar away from the
sun. The inversion of the lidar data is
based on a forward stepping approach similar to the one used by Porter et al.
[2000] but with different constraints.
Here the lidar calibration (which is largely unknown) is adjusted so
that the largest lidar integrated optical depths are in agreement with the
largest sun photometer measured aerosol optical depths. For the lidar inversion, we also assume the aerosols have no absorption and
have an aerosol phase function value (at 180º scattering angle) of 0.3 based on
Mie calculations from existing aerosol models of the volcanic aerosol (vog) [Porter
and Clarke, 1997]. Based on the lidar measurements, it was seen that the
majority of the volcano plume was below 500 m height but was irregularly shaped
possibly due to atmospheric turbulence.
3. Aerosol Flux
Rates
In order to estimate the flux of dry
sulfuric acid aerosol we follow Eq. 1,
![]() , (1)
, (1)
where τi
is the aerosol optical depth for interval i across
the plume, wi is the effective width for
that interval and γ is the aerosol mass scattering efficiency γ (in m2/g)
(discussed below) at the same wavelength as the aerosol optical depth being
used (500 nm in this case). An aerosol
mass scattering coefficient of 7.7 m2 g-1 was used for
these calculations. This value was based on the average of Mie theory calculations
from the size distributions shown in Fig. 2 with a standard deviation of 2.4 m2
g-1. In obtaining this value we have assumed the hygroscopic
aerosols have a water uptake that is slightly less than sulfuric acid [Tang,
1980] due to the presence of small amounts of ammonium [Porter and Clarke,
1997]. An average relative humidity of 65% was assumed for the lowest 500 m
based on the
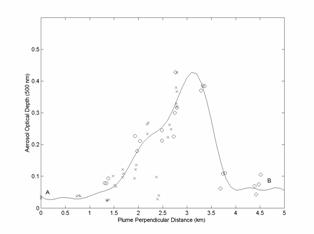
Figure 4. Aerosol optical depths (at 500 nm) plotted
along a line perpendicular to the volcano plume. The x symbols show
measurements made on the upper part of the road while o symbols show the
measurements made on the lower part of the road. The plume perpendicular angle
was chosen to produce the best overlap. The symbols A and B show the position
of the measurements on Fig. 1 and Fig. 4.
The
aerosol optical depth across (perpendicular to) the plume is needed to use Eq. 1.
Unfortunately, the road does not cut straight across the plume (Fig. 1)
so it was necessary to convert the position of the aerosol optical depth
measurements to their position along a line perpendicular to the plume. Figure
4 shows the aerosol optical depths along this perpendicular line. All the
measurements at each location are shown in Fig. 4 while only the average values
at each location are shown in Fig. 1. The measurements labeled A and B are indicated in Figs. 1 and 4. A curve fit to the
measurements was carried out and Eq. 1 was then used
to calculate dry aerosol mass flux rates of 47, 60, and 52 (±40%) Mg d-1
for passes 2, 3 and 4. Background
aerosol optical depths (on either side of the plume) were averaged and
subtracted from the in-plume optical depths prior to using Eq.1. Aerosol flux
rates calculated from the lidar data gave very similar
values, which is expected since the lidar is calibrated with the sun
photometer measurements. The first pass
could not be used because part of the plume was beyond the road. Accounting for the difference in molecular
weight between SO2 and H2SO4, the formation of
53 Mg d-1 of vog aerosol (the average of the three passes)
corresponds to 35 Mg d-1 of SO2 loss between the vent and
the measurement point. We have assumed that all the S(VI)
was derived from S(IV).
4. SO2
Half Life in the
Regular measurements of the SO2
column abundance in the Pu‘u O’o plume have been
made by the U.S. Geological Survey Hawaiian Volcano Observatory since 1992
using vehicle-based COSPEC [Sutton et al., 2001; Elias et al., 1998]. These data are combined with locally recorded
wind speeds to estimate SO2 emission rates. Based on COSPEC data and
field observations of lava effusion rate estimates, which bracketed our aerosol
measurements, we estimate that the SO2 emissions on
![]() (2)
(2)
where
Co and C are the initial and final concentrations, and t1/2
is the half-life (so t1/2 = ln(0.5)/k). Assuming that all the S(VI)
was derived from S(IV), we obtain a SO2 half-life of 6.0 hours in
the Pu‘u O’o plume. Adding
in uncertainty in the aerosol and SO2 flux rates results in
half-life values ranging from 3.5-10 hours.
Here we have assumed the SO2 oxidation occurs in the
atmosphere but some probably occurs right above the vent. This would make the
atmospheric half-life longer than the 6.0 hours estimated here. In comparison,
Finlayson-Pitts & Pitts [1986] summarize measurements of SO2
oxidation rates and find half life values ~6.6 hours have been reported in many
studies [Gillani et al., 1981; Newman, 1981], although
values up to 69 hours [Lusis et al., 1978] and down
to 1.9 hours [Mezaros et al., 1977] have also been
reported. The general trend is toward
faster conversion rates in low latitudes (more solar irradiance) and when
partially cloudy conditions exist where in cloud processes can occur [Eatough et al., 1994].
5. Conclusions
Sun photometer and lidar measurements were
made under the Hawaii Kilauea Pu‘u O’o
Volcano plume to measure aerosol flux rates. Accounting for the wind speed and
aerosol hygroscopic properties, average aerosol dry mass flux rates of 53 Mg d-1
H2SO4 were obtained.
Using the calculated SO2 emission rate, the SO2
oxidation half-life was estimated to be 6.0 hours. Further studies are needed to test these
results. Combined aerosol and gas measurements
at different distances downwind in the plume would be important for helping to
access the long-term impact of the Pu‘u O’o plume on the local ecosystem and residents. Similar
studies at other volcanoes where continuous low-level degassing can continue
for years (e.g.,
Acknowledgments. This
effort was supported by NASA grants NAG5-10640 and NAG5-6340 and by the U.S.
Geological Survey, Volcano Hazards Program. We also wish to thank Harold Garbeil for valuable assistance. SOEST contribution # 5953.
References
Andres, R. J., P. R. Kyle, J. B. Stokes, and W. I.
Rose, SO2 from episode 48A eruption, Hawaii: Sulfur dioxide
emissions from the episode 48A east rift zone eruption of Kilauea volcano
Hawaii. Bull. Volcanol.
52, 113 – 117, 1989.
Casadevall, T.J., Rose, W.I., Fuller,
W.H., Hunt, W.H., Hart, M.A., Moyers, J.L., Woods,
D.C., Chuan, R.L., and Friend, J.P., Sulfur dioxide and particles in quiescent
volcanic plumes from Poas, Arenal,
and Colima volcanoes, Costa Rica and Mexico, J. Geophys. Res., 89, 9633-9641, 1984.
Eatough, D.J., Caka, F.M., and
Farber, R.J., The conversion of SO2 to sulfate in the atmosphere, Isr. J. Chem., 34, 301-314, 1994.
Elias, T., Sutton, A.J., Stokes, J.B., and Casadevall, T.J., Sulfur dioxide emission rates of Kilauea
Volcano, Hawaii, 1979-1997: U.S. Geological Survey Open-File Report 98-462. WWW
address http://hvo.wr.usgs.gov/products/OF98462/,
1998.
Finlayson-Pitts, B, and J.
Pitts, Atmospheric Chemistry: Fundamentals and Experimental Techniques, Wiley-Interscience
Publication, 1986.
Gillani, N.V., S. Kohli,
and W.E. Watson, Gas to particle conversion of sulfur in power plant plumes,
Parameterization of the Conversion rate for dry, moderately polluted ambient
conditions, Atmos. Environ., 15, 2293, 1981.
Heliker, C.C., Mangan, M.T.,
Mattox, T.N., Kauahikaua, J.P., and Helz, R.T., The character of long-term eruptions:
inferences from episodes 50-53 of the Pu`u O`o-Kupaianaha eruption of Kilauea Volcano: Bulletin of Volcanology, v. 59, no. 6, p. 381-393, 1998.
Hobbs, P.V., Tuell,
J.P., Hegg, D.A., Radke,
L.F., and Eltgrowth, M.W., Particles and gases in the
emissions from the 1980-1981 volcanic eruptions of Mt. St. Helens, J. Geophys. Res., 87, 11062-11086, 1982.
Lienert, B.R., J.N. Porter, and S.K. Sharma,
Repetitive Genetic Inversion of Optical Extinction Data, Applied Optics, 40, 21,
3476-3482 , 2001.
Lusis, M.A., Anlauf, K.G.,
Barrie, L.A., Wiebe, H.A., Plume chemistry studies at
a northern Alberta power plant, Atmos. Environ., 12,
2429, 1978.
Mezaros, E., Moore, D.J., Lodge, J.P. Jr., Sulfur
dioxide-sulfate relationships in Budapest, Atmos.
Environ., 11, 345, 1977.
Newman, L., Atmospheric oxidation of sulfur dioxide: A
review as viewed from power plant and smelter plume studies, Atmos. Environ., 15, 2231, 1981.
Porter, J., Clarke, A., An Aerosol Size Distribution
Model Based on In-Situ Measurements. J. Geophy. Res.,
102, 6035-6045, 1997.
Porter, J.N., Lienert, B., S.K. Sharma, Using the
Horizontal and Slant Lidar Calibration Methods To Obtain Aerosol Scattering
Coefficients From A Coastal Lidar In Hawaii, Journal of Atmospheric and Oceanic
Technology, 17, 1445-1454, 2000.
Porter, J, Miller, M., Pietras,
C.: Use of the MicroTops Sunphotometer
On Ships, Journal of Atmospheric and Oceanic Technology, 18, 765-774, 2001.
Realmuto, V. J., A. J. Sutton, and T. Elias. Multispectral
thermal infrared mapping of sulfur dioxide plumes: A case study from the East
Rift Zone of Kilauea volcano,
Rose, W.I., Chuan, R.L., Giggenbach, W.F., Kyle, P.R., and Symonds,
R.B., Rates of sulfur dioxide and particle emissions from
Stith, J.L.,
Sutton, A.J., Elias, T., Gerlach,
T.M., Stokes, J.B., Implications for eruptive processes as indicated by sulfur
dioxide emission from Kilauea volcano, Hawaii, USA, 1979-1997: Journal of Volcanology and Geothermal Research, v. 108, p. 283-302,
2001.
Sutton, J., Elias, T., Hendley,
J.W.I., and Stauffer, P.H., Volcanic air pollution--a hazard in
Tang, I.N., Deliquescence properties and particle size
change of hygroscopic aerosols. Generation of aerosol, Ann Arbor Science
Publishers, 1980.
Watson, I.M. and C. Oppenheimer, Particle size
distribution of
Watson, I.M., and Oppenheimer, C., Particle-size
distributions of ash-rich volcanic plumes determined by sun photometry, Atmospheric Environment, 35, 3561-3572,
2001.
______
Mailing addresses: author names should be grouped by
address and listed alphabetically.
(Received
accepted
1Now at,
Also at, Formerly at, On leave at, and On leave from are acceptable. Do not
include mailing information.
AGU Copyright:
Copyright 2001 by the American Geophysical
Paper number 2001GL012345.
0094-8276/01/2001GL012345$05.00
Public Domain Copyright:
3.09This paper is not subject to
Paper number 2001GL012345.
Crown Copyright:
Published in 2001 by the American Geophysical
Paper
number 2001GL012345.