

EPMA page
This section is dedicated to the electron microprobe and some of the recent things we've been doing at UH with our FE-Gun JEOL Hyperprobe 8500F
TECHNIQUE DEVELOPMENT AND APPLICATIONS
Example 1-Calibration of x-ray element maps
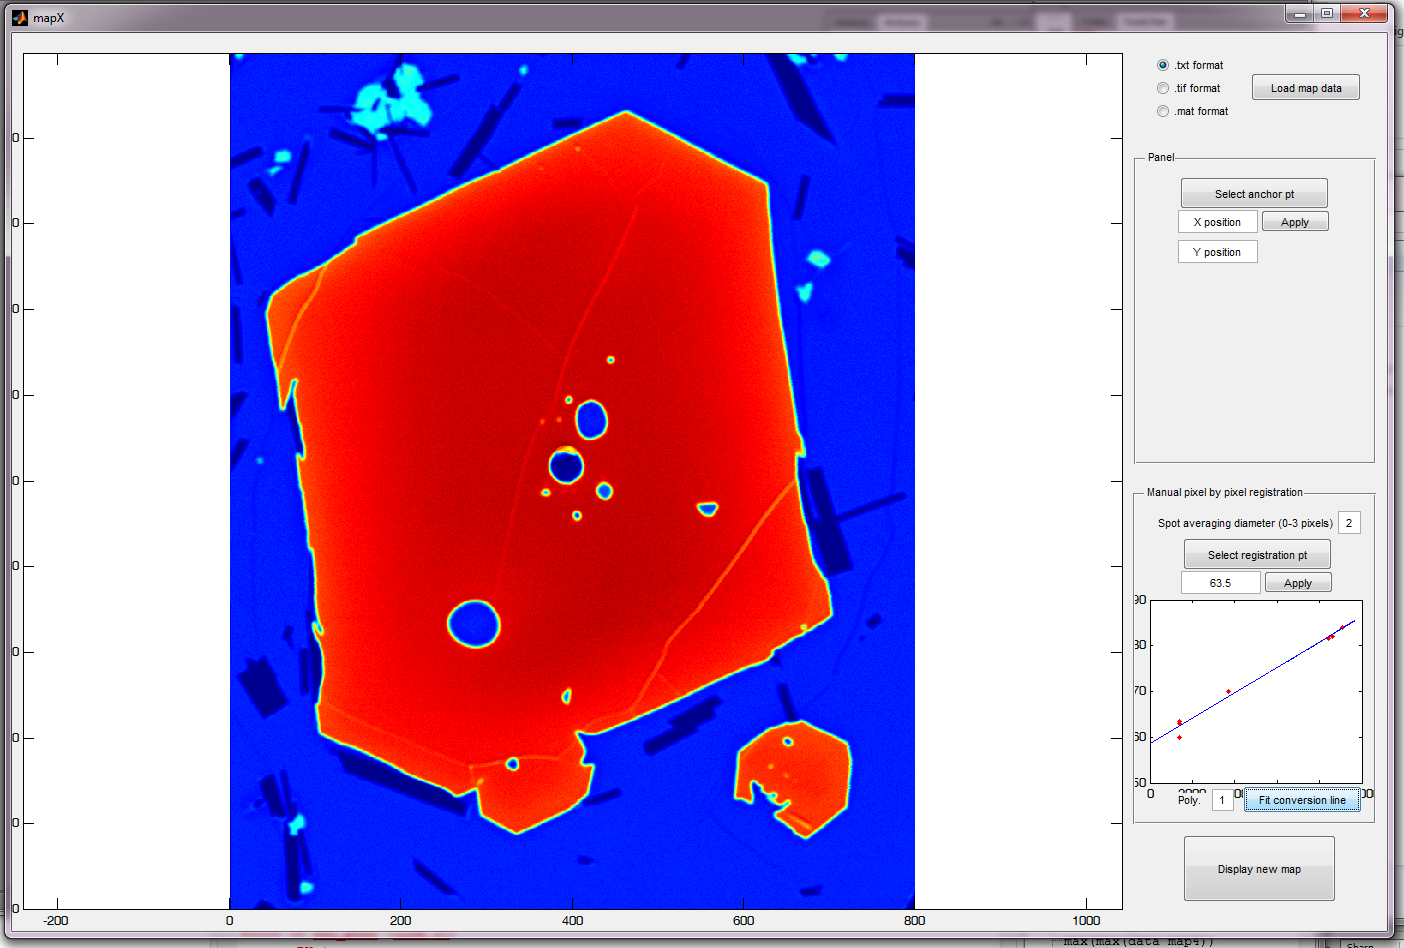
Element maps are typically matrices of intensity values measured at each point within a defined 2D grid ('pixels'). They cannot be used as such for quantitative purposes unless they can be calibrated. I am developing simple Matlab routines with user-friendly interfaces to calibrate these maps. The operator needs to have a few 'anchor' points with measured values of an element of interest, which she/he can use to build a calibration line/curve and express the new map as true concentration values. Below is an image of the interface and an example for a map for which we possessed a few anchor points:
The calibrated final 'Forsterite' map is then given as an output (notice it looks the same because the calibration was taken as linear):
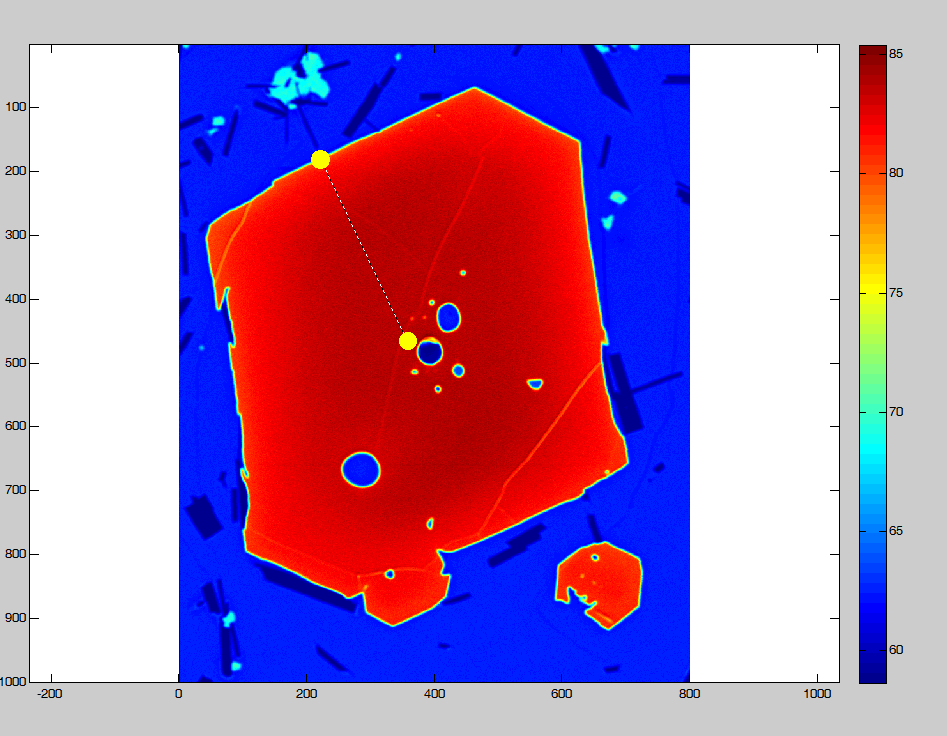
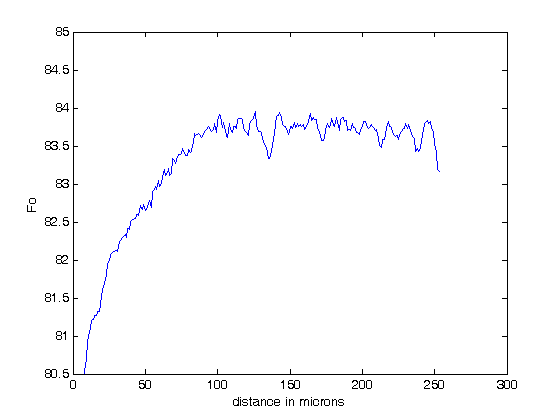
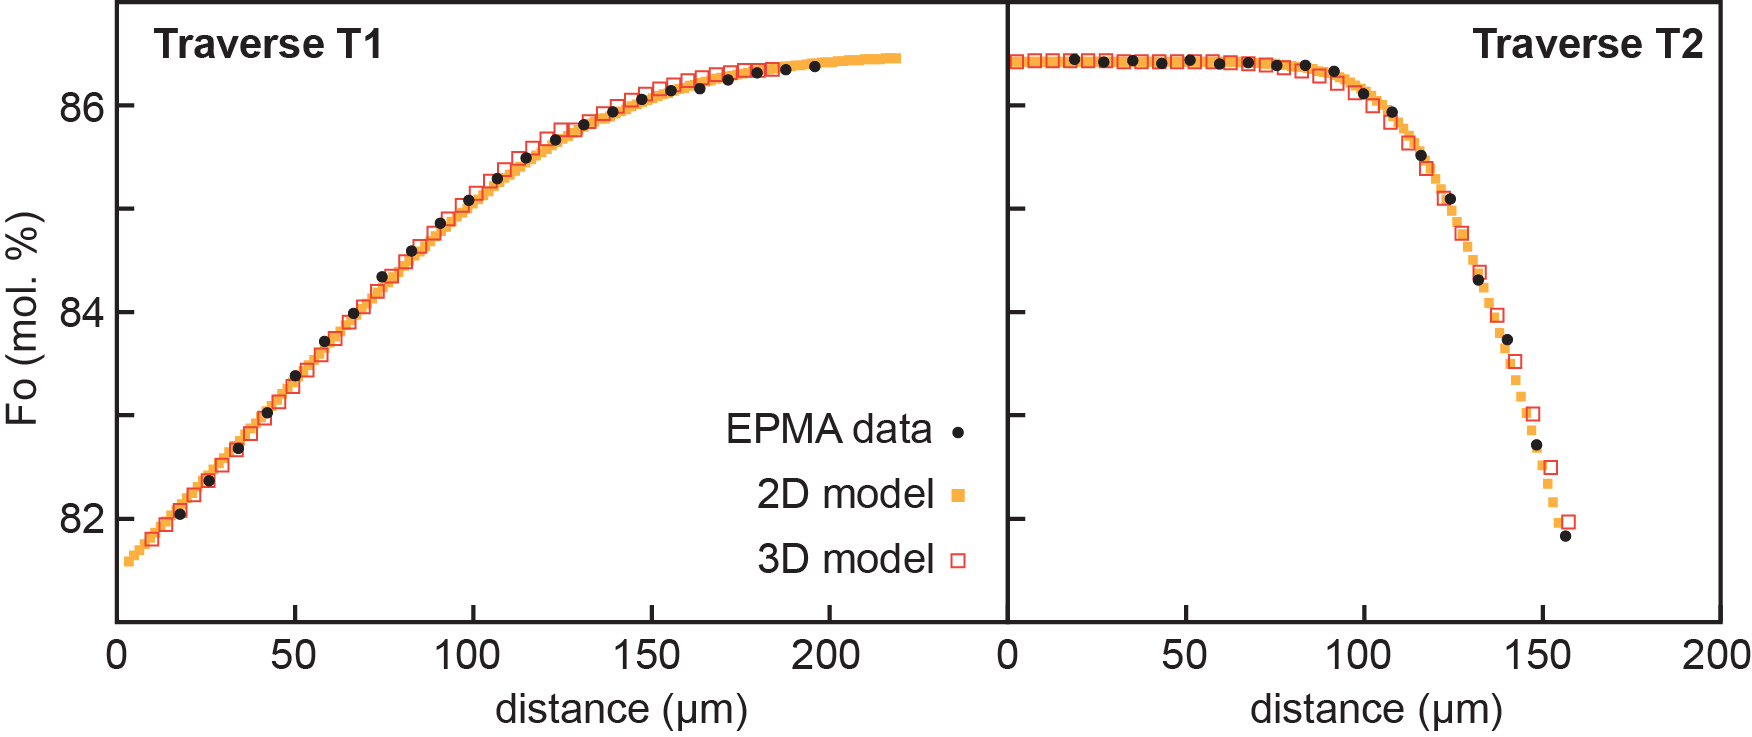
A transect (between the two yellow dots above) can be then be taken anywhere on the resulting map and be used for instance for diffusion modeling:
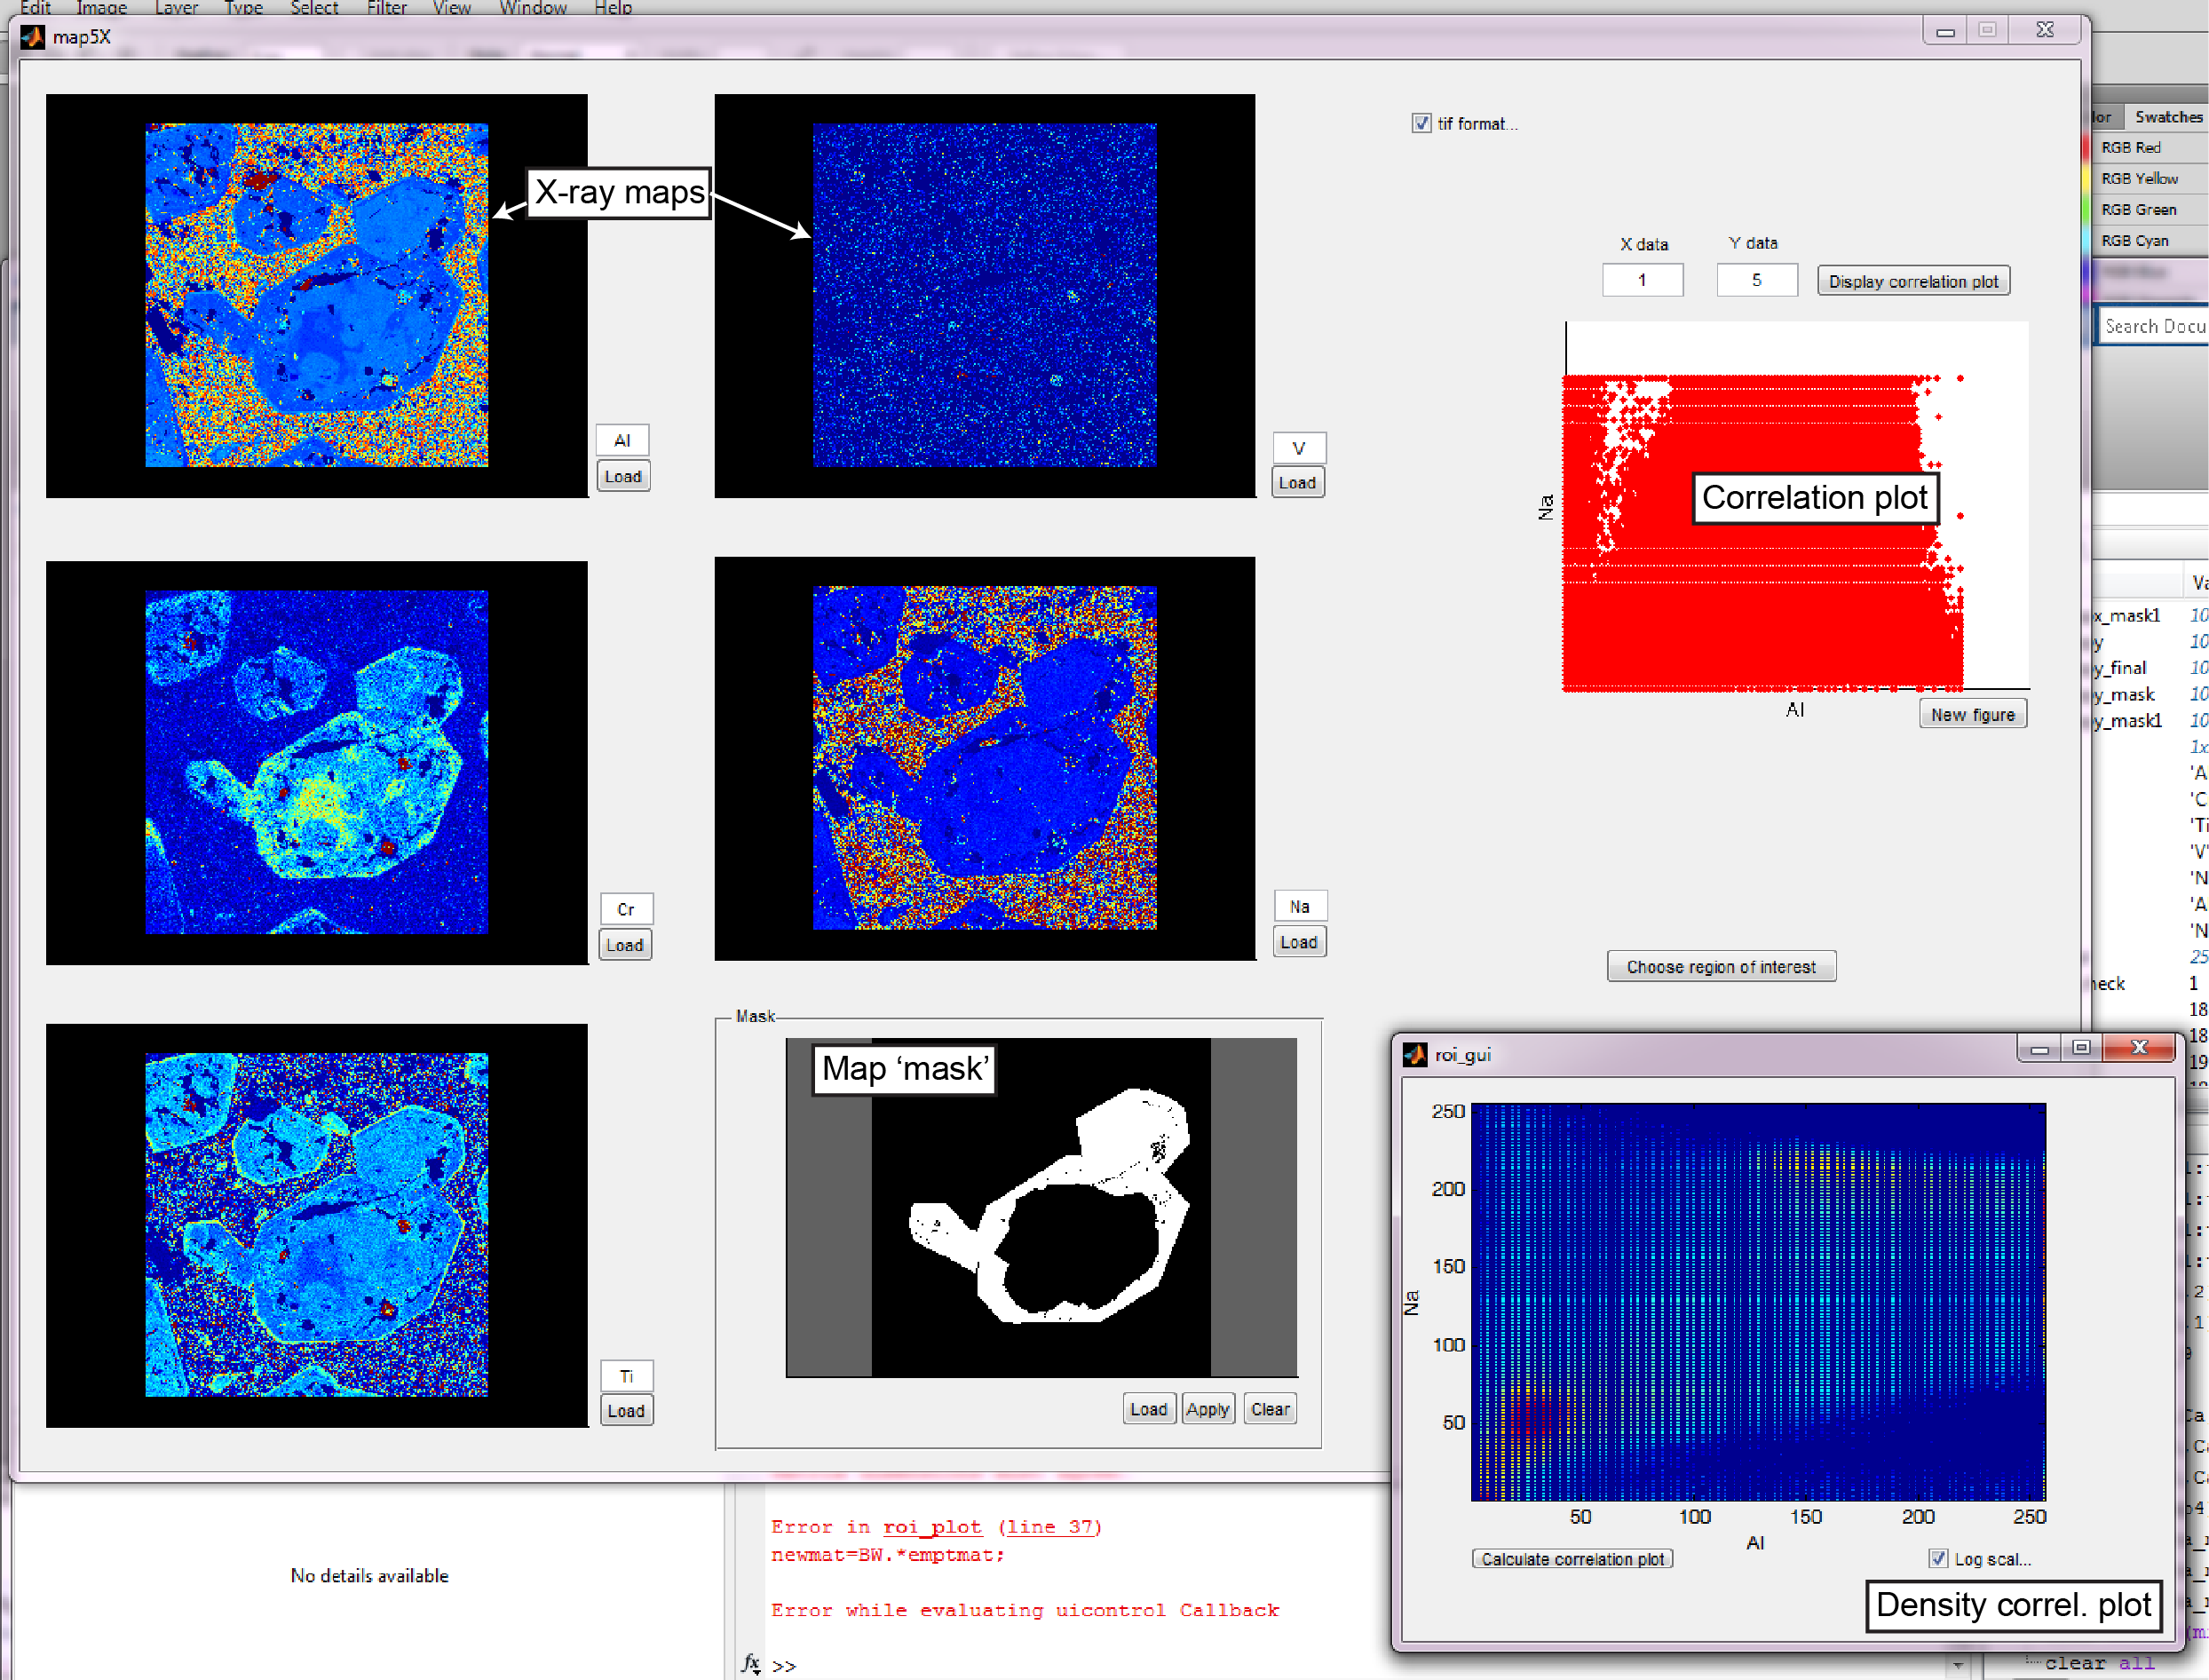
Example 2: Finding correlation between elements from different x-ray maps
Another useful technique in development is the ability to check for covariations between different elements obtained within the same map routine (typically 4-5 elements per map). I am building tools to extract this type of information by allowing the operator to select two elements and display correlation plots as a function of 'data density' (see pyroxene data below for example, maps from Julia Hammer). The operator can also select an area of interest by using 'color masks'.
Example 3-Application: resolving major, minor and trace element zoning in
olivine
The recent advances in EPMA are allowing the mapping of elements at unprecedented spatial resolutions (down to 200nm). We've been using x-ray element maps of various elements within olivine to decipher their crystallization and subsequent history (e.g. magma mixing and diffusive re-equilibration). Below is an example of a nice 'skeletal' olivine, with the phosphorous zoning tracking the early growth history of the crystal, while the Fe-Mg (here treated as Fo component) displays a completely different portion of this olivine's history. This latter part of the olivine's history can be modeled via diffusion simulations in 2D. We can directly use the calibrated Fo map (see calibration tools above) for our 2D diffusion model and obtained timescales that are more robust than using typical 1D models.
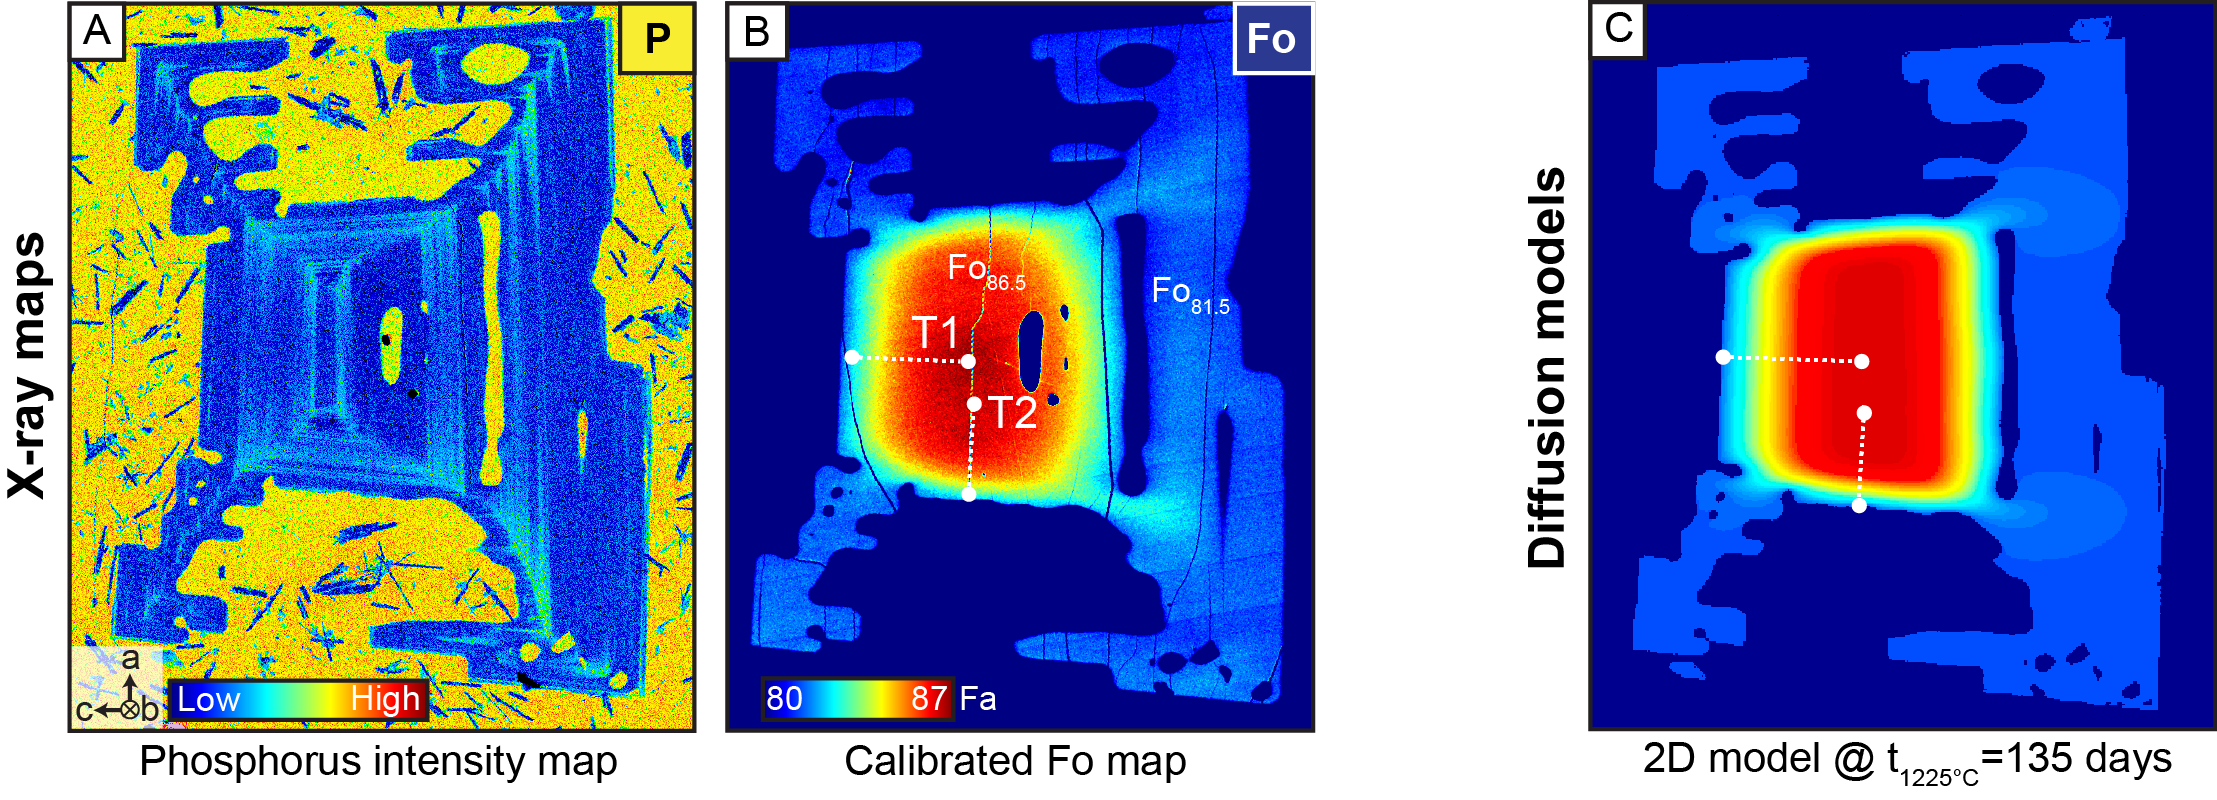
In this case, this olivine grew rapidly within a melt (phosphorous-rich 'skeleton'), and was left to re-equilibrate for about 4-5 months before being erupted (paper in review).
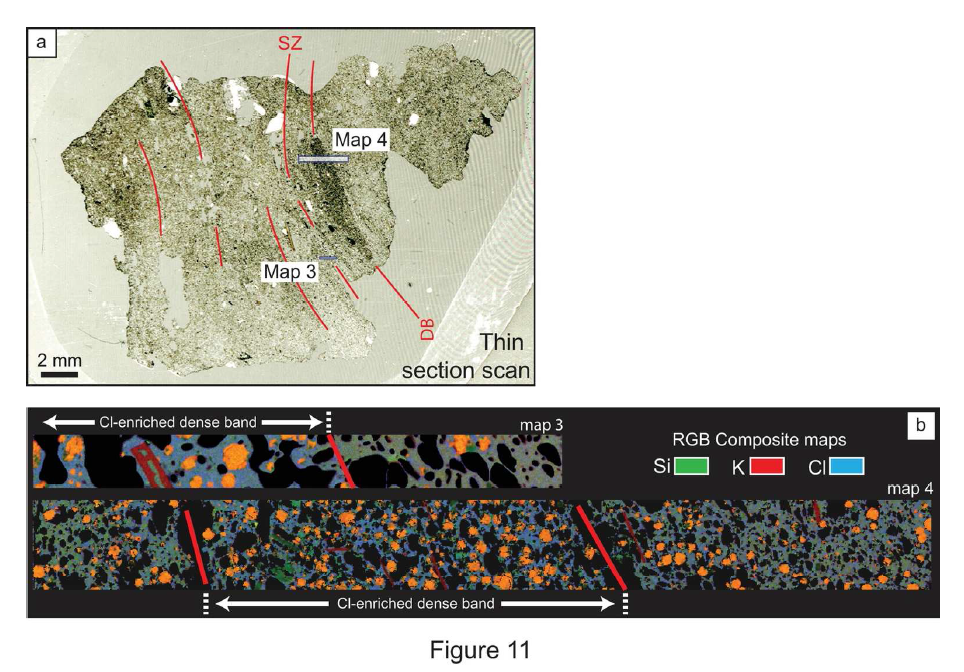
4-Mapping Cl zonation in vesicular glasses
I've also been using x-ray element maps of volatiles such as Cl to determine sample-scale to a few hundred of micron variations in degassing behavior within pyroclasts. Here is an example of a Cl map measured within a pumice from the 79AD eruption of Vesuvius (cf. Shea et al. 2014):